The Green Bonds Market Summary – H1 2020 focuses on the latest market developments in labelled green bonds and loans.
The summary highlights issuance trends and significant data points for a period significantly impacted by the global COVID-19 pandemic.
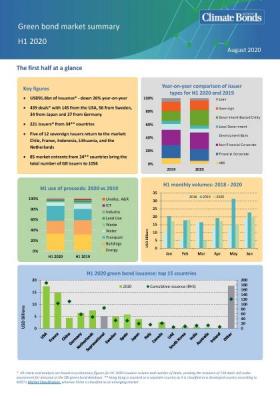
The global green bond market at a glance:
-
Labelled green bond issuance: USD91.6bn down 26% year-on-year (up 48% on H1 2018)
-
Sub-sovereign issuers lead with 29% of volume, most coming from government-backed entities
-
Non-financial corporates comprise a further quarter of H1 green bond volume
-
Developed markets make up most (82%) of issuance with the US in the lead
-
Sovereign issuance remains steady: 5 repeat issuers keep this key segment’s share at 14% of total
-
A significant pointer to growing diversity in the wider sustainability market, USD94.4bn of other labelled bonds funding green and social projects, including pandemic response
-
Largest deals come from railway operators, utilities and commercial banks
-
The Chilean and Dutch governments issue Certified Climate Bonds
Certified Climate Bonds
- Certified Climate Bonds (CCBs) accounted for a quarter of the half-year volume (+6% year-on-year)
- Certification came via issuers in 17 countries, with 12 first time issuers (see the Certification Database for more information)
- Top 3 Certified bond issuers in H1 included multiple sovereign issuances from Chile (USD3.8bn) and the Netherlands (USD3.4bn). Together they constituted nearly half (48%) of H1 2020 Certified bond volume
- The largest H1 Certification came from Société du Grand Paris (USD2.7bn) using Climate Bonds streamlined Programmatic Certification process. SNCF and New York MTA also prominent as programmatic issuers.
Cumulative Green - Major Regions
On a regional basis total cumulative green issuance for Europe has reached USD362.7bn, with France leading on USD102.0bn followed by Germany on USD57.8bn and Netherlands on USD44.3. Sweden on USD33.4bn and Spain on USD31.4bn round out the top 5.
In Asia-Pacific, regional total cumulative sits at USD194.1bn with China well in front at USD111.7bn then a gap to Japan on USD19.3bn, Australia on $12.7bn with India at USD11.4bn and South Korea at USD8.3bn comprising the remaining top 5 nations.
Total cumulative issuance for LATAM is USD17.9bn at 30 June. Chile leads at USD7.0bn followed by Brazil usd5.7bn, Mexico USD2.1bn and Peru on USD886mn and Argentina on USD 637mn filling 4th and 5th spots respectively.
2019 Annual Figures - State of the Market Report
This H1 2020 Report follows in sequence the global State of the Market 2019 report, the first of a new annual series analysing each calendar years market developments in detail including global trends in green bond, loan and sukuk issuance and avenues for market growth. The full 2019 report can be found here.