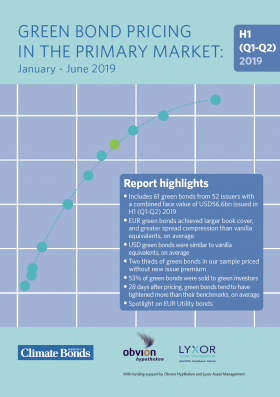
Green bond pricing in the primary market: January - June 2019 monitors the performance of 46 EUR and 15 USD denominated benchmark-sized green bonds with a total value of USD56.6bn. This is the 8th iteration in the series of Green Bond Pricing reports that commenced in 2016.
Among our H1 2019 sample, 32 bonds from 26 issuers had enough data to build yield curves. Eighteen of those issuers have already issued at least one green bond. This includes sovereign green bonds issued by the Netherlands and COP 25 hosts Chile during the reporting period, and Certified under the Climate Bonds Standard.
Notable during the reporting period was new issue premium characteristics. Twelve GBs priced with normal new issue premia, 15 priced on their curves, and six exhibited a greenium: in EUR, EIB 2042, Terna 2026, Vodafone 2026, KfW 2027, and Netherlands (Sovereign) 2040, and in USD Chile (Sovereign) 2050.
In spotlight studies of TenneT, Vodafone and development banks KFW and NRW positive pricing differentials between green and vanilla bonds in the sample were observable.
With funding support by Obvion Hypotheken and Lyxor Asset Management.
Detailed media release is available here.
Previous Pricing Reports:
- Green Bond Pricing in the Primary Market: Q4 2016 Snapshot can be found here.
- Green Bond Pricing in the Primary Market: Jan 2016 – March 2017 can be found here.
- Green Bond Pricing in the Primary Market: April – June 2017 can be found here.
- Green Bond Pricing in the Primary Market: July – September 2017 can be found here.
- Green Bond Pricing in the Primary Market: October – December 2017 can be found here.
- Green Bond Pricing in the Primary Market: January – June 2018 can be found here.
- Green Bond Pricing in the Primary Market: July – December 2018 can be found here.
