Latest research reveals the gains of going green across primary and secondary markets
 The latest Green Bond Pricing in the Primary Market is now available, assessing the performance of issuances in the second half of 2021. The findings follow the H1 2021 report and longer-term Climate Bonds analysis which suggests that pricing benefits of green bonds are pervasive.
Now in its 13th iteration, this research has embedded the concept of ‘greenium’ in the discourse of sustainable finance. The greenium represents a great result for issuers as it means they pay less to finance their green bonds compared to vanilla equivalents.
However, this does not necessitate a loss for investors, as this research reveals the premium paid by the investor on green debt can be justified by the strength of the secondary market performance of green bonds when compared to vanilla equivalents.
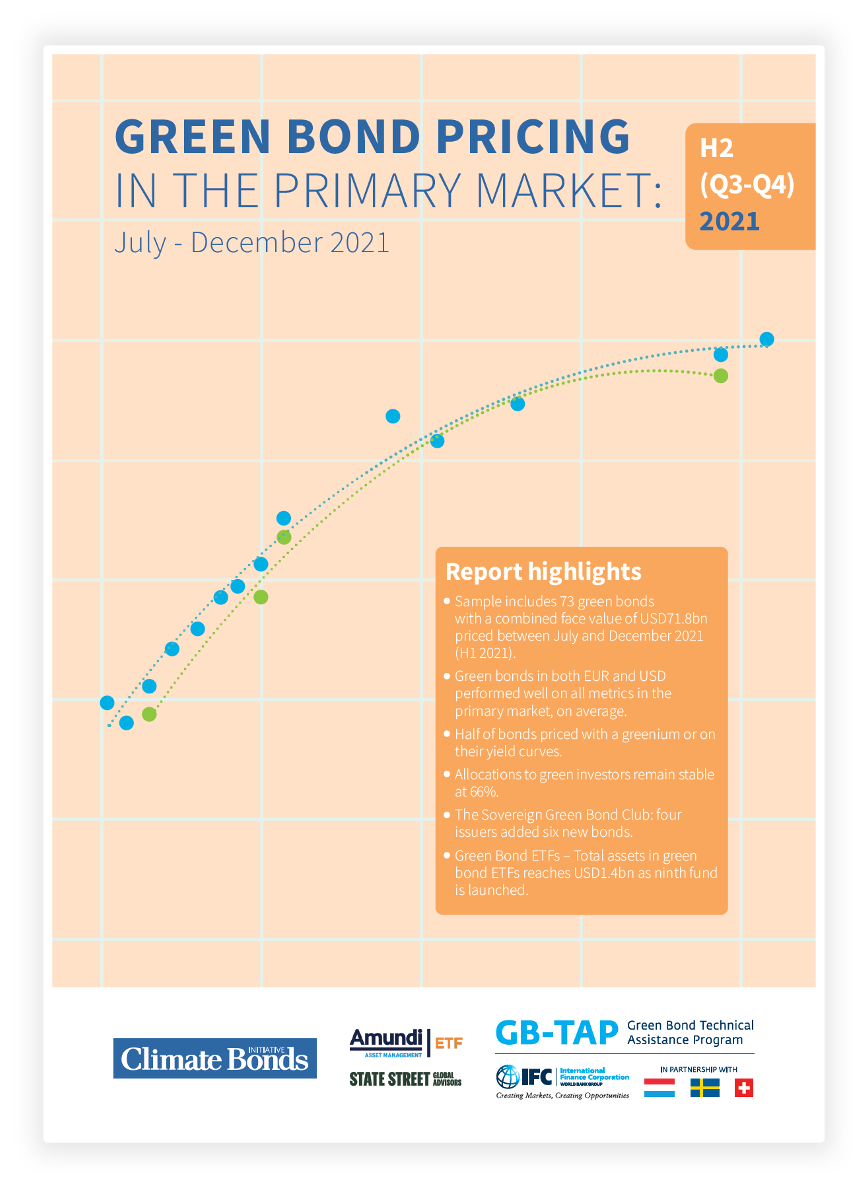
The report includes the assessment of 73 green bonds with a combined face value of USD71.8bn. Pricing benefits have remained visible as the market expanded to over half a trillion USD in issuance in 2021 and USD1.6 trillion since market inception in 2007, based on the Climate Bonds Green Bond Database.
The Greenium remains visible
When a bond is issued with a higher price, and thus has a lower yield compared to outstanding debt, this is known as a new issue concession. New issue concessions are often present in green bonds, a phenomenon we have termed a ‘greenium’ in this reporting series.
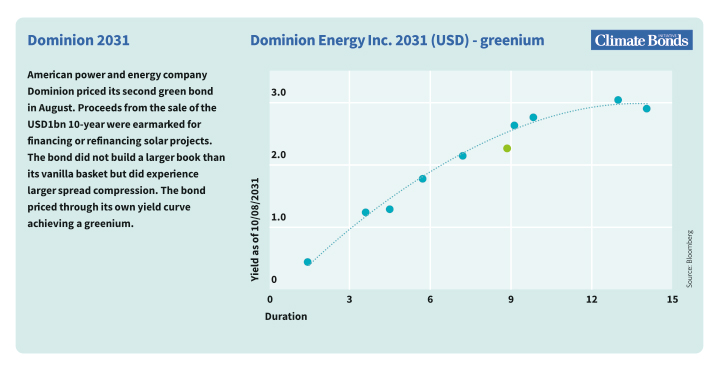
Issuers pay less to fund green bonds as the yield is lower, and the greenium can be visualised as it will price inside its own yield curve, mapped through the pricing of vanilla equivalents.
The American energy company Dominion’s issuance in August 2021 provides an example of greenium observed as seen below in green.
The report observes that, on average, both EUR and USD green bonds in the sample achieved larger book cover and spread compression compared to vanilla equivalents. Half of the bonds with yield curves priced with a greenium or inside their yield curves.
Yield curves were available for 34 non-sovereign bonds in our sample and 17 of those were priced on or inside their yield curves.
Two-thirds (66%) of green bonds were allocated to investors describing themselves as green.
Sovereign Green Bond and ETF Highlights
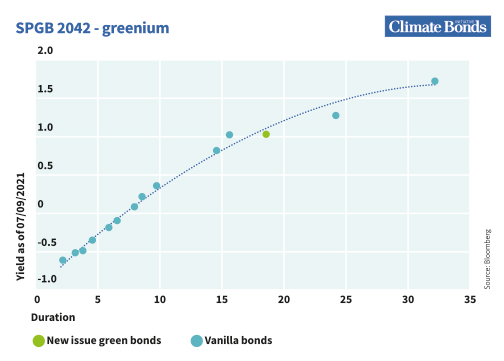
In H2 2021, four sovereigns brought six new green bonds denominated in either EUR or USD which qualified for our analysis in our pricing research.
Spain and Korea priced their first sovereign green bonds, while Germany and Hong Kong returned to the market with new bonds. Yield curves were available for Spain, Germany and Hong Kong (USD), with Germany and Spain's bond (SPGB 2042) exhibiting greenium (see below).
A ninth green bond ETF, the Lyxor Euro Government Green Bond DR UCITS, was launched in July with an initial size of EUR48m.
At the end of 2021, there were nine green bond ETFs with combined fund assets of USD1.4bn - an increase of 18% on the prior period (14% without the new fund). The growth of green bond ETFs adds further demand pressure to green bonds in the secondary market.
Investors benefits for secondary market performance
The report demonstrates that green bonds experience stronger secondary market performance compared to vanilla equivalents. The research reveals that green bonds achieved a greater magnitude of spread, tightening after both 7 and 28 days when compared to baskets constructed of matched vanilla bonds and indices. The performance of green bonds in the secondary market can help investors to justify the greenium.
The resolve of green bonds to be tested
Central banks are winding down post-pandemic support and rates are expected to increase in 2022. Going into year-end, investors are naturally cautious of investments that could face volatility by rising rates, including all types of bonds.
Green bonds would be naturally more vulnerable to this trend due to the slightly longer duration of green bond indices. However, noting the rise in demand for sustainable investments across the board, the green label may offer some protection, though not complete immunity, against reallocations.
The Last Word
Demand for green debt has been soaring since market inception, with over USD1.6tn issued to date and 2022 touted to see the first annual trillion. Likewise, pricing advantages are expected to show endurance during a changing economic landscape, driven largely by this heavy demand outstripping the supply as asset managers look to address climate risk in their portfolios.
Sean Kidney, CEO of Climate Bonds, is optimistic of green bonds performance during these last turbulent years. Sean remarked:
“The demand for green bonds is defiantly withstanding the economic, social and geopolitical turmoil of the last couple of years. The ability to weather storms and survive downturns is absolute gold dust and promises value across primary and secondary markets.”
We would like to thank Lyxor ETF-Amundi Group, IFC, and SSGA for their support in producing this paper.
Report findings will be presented in a Webinar with panellists from the Spanish Treasury, Amundi Group, Smurfit Kappa Group and SSGA.
Date: Tuesday, 30th of March 2022
Time: 15:00 Paris / 14:00 London / 09:00 New York / 22:00 Hong Kong, Singapore
Register here.
‘Til next time,
Climate Bonds
Upcoming Events not to be missed!
Climate Bonds Standard expands into hard-to-abate sectors this year, enabling Certification for debt issuance from heavy industry sectors!
Chemicals sector is one of the biggest industries in the world and the largest industrial user of energy, accounting for 30% of energy consumption. It also represents around 5% of total global GHG emissions. Join us at the launch of the Public Consultation Basic Chemicals Criteria, as we present the draft Criteria that will enable green transition pathways for the industry that serves as building blocks for thousands of products and materials.
Date: Tuesday 29th March
Time: 14:00 BST (London) / 15:00 CEST (Paris) / 09:00 EDT (New York) / 21:00 (Singapore)

Special Event: Ukraine War & Global Energy Impacts to 2030 - How clean energy will outpace fossil fuels
The Russia Ukraine war has triggered both a policy shift towards clean energy independence and debate around a longer life span for fossil fuels in the global energy mix.
Will the crisis extend fossil fuel dependency? Or will policy makers double down on energy security through renewables?
We bring you a special Webinar Event from Global NGOs Inevitable Policy Response (IPR), Carbon Tracker Initiative and Climate Bonds.
Using IPR forecast policy scenarios (FPS), Carbon Tracker oil and gas industry analysis and Climate Bonds market intel this special event for investors and policy makers will assess the current uncertainties and political responses against long term trends in climate policy, green finance and energy transition.
Date: Monday 4th April
Time: 14:00 BST (London) / 15:00 CEST (Paris) / 09:00 EDT (New York) / 21:00 (Singapore)
