Green Bonds Reach Record $255bn for CY 2019 - New Milestone
$350-400bn Climate Bonds initial forecast for 2020
$1trillion in annual green investment in sight for early 2020s
LONDON: 16/01/2020 14:00 GMT: Climate Bonds Initiative’s analysis of annual green bond and loan issuance for CY 2019 shows a December 31st tally of USD254.9bn that meet internationally accepted definitions of green, a new global record. The 2019 total is up 49% on the final 2018 figure of USD171.1bn and just above our January 2019 forecast of USD230-250bn for the year. Of the total, USD 6.8bn (2.6%) are green loans.
Climate Bonds Initiative forecasts USD350-400bn in global annual green bond/loan issuance for the CY 2020.
Global Rankings
Climate Bonds data shows the largest international green bond market was the European Union (EU) with USD106.7bn of annual issuance. The USA tops national rankings with USD50.6bn, China at USD30.1bn & France the third largest green issuing nation at USD29.5bn. Germany, Netherlands, Sweden, Japan, Italy, Canada, Spain, filled out the remaining Top 10 national positions. Supranationals (MDBs, DFIs) issued USD 14.5bn.
Collectively, the EU, US and China account for a healthy 73.5% of the CY 2019 global total.
2019 At a Glance
The top 5 cumulative green bond issuers for 2019 were Fannie Mae (USD22.8bn), KFW (USD9.02bn), Dutch State Treasury Agency (USD6.66bn), Republic of France (USD 6.57bn) and Industrial & Commercial Bank of China (ICBC) (USD5.85bn).
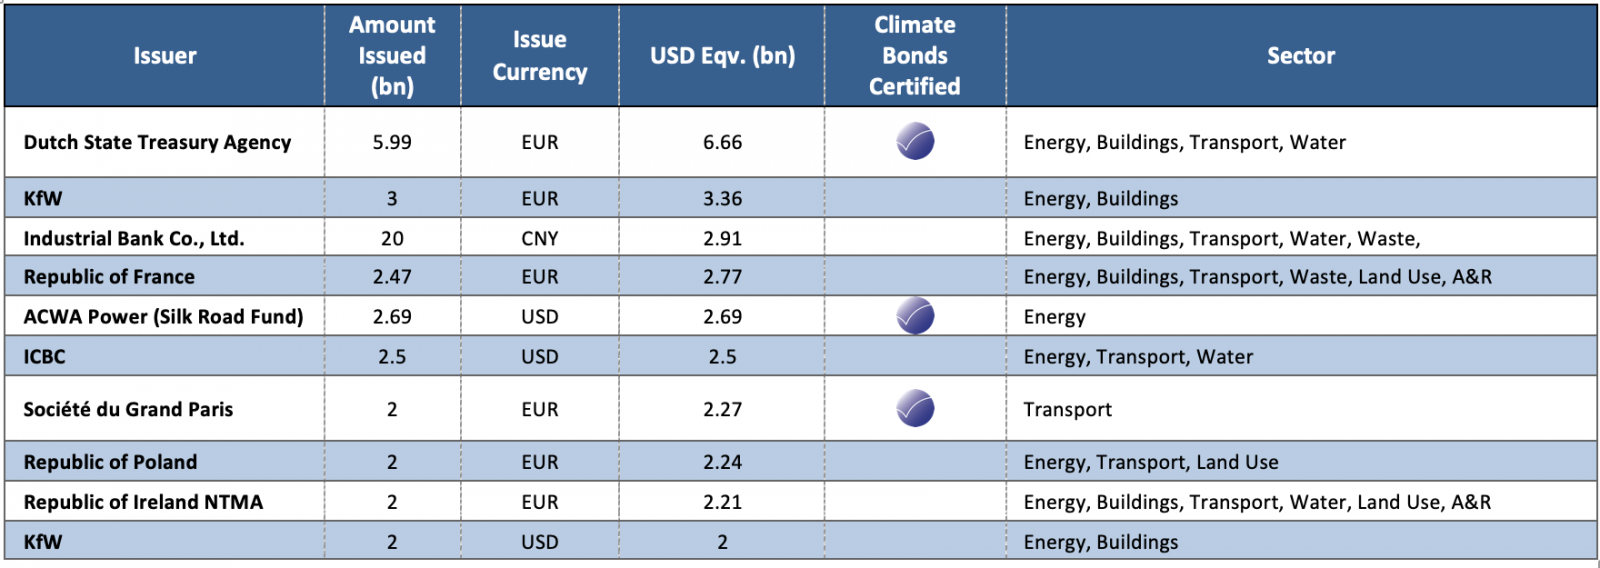
The five largest individual green bonds/loans issued in 2019 were from Dutch State Treasury Agency (Climate Bonds Certified) at EUR5.99bn (USD6.66bn), KfW EUR3bn (USD 3.36bn), Industrial Bank Co., Ltd. CNY20.0bn (USD2.91bn), Republic of France EUR2.47bn (USD2.77bn) and the Noor Energy 1(ACWA Power, Silk Road Fund) (Climate Bonds Certified) USD2.69bn green loan, funding single largest Concentrated Solar Power (CSP) site in the world.
Clean energy dominated overall Use of Proceeds at 31.5%, followed by low carbon buildings on 29.3%, low carbon transport 20.2%, water 9.3%, with land use and waste both at 3.5% and other categories comprising the remainder.
Sovereign Green Bonds
Sovereign green bonds in 2019 reached just over USD25.8bn (approx. 10%) of total issuance for the year, comprised of both repeat sovereign issuers and inaugural transactions from Chile and the Netherlands. The cumulative total of issuing nations/regions has reached twelve (see Notes).
Chile has announced additional green issuance in 2020, France and Netherlands are expected to issue again and inaugural sovereign issuance has been foreshadowed from Egypt, Germany, Italy, Kenya, Sweden and Spain, among others.
Climate Bonds Certification
Climate Bonds Certified bonds/loans for the year reached new record (USD39.3bn) of volume, reflecting an acceleration of green issuers demonstrating international market best practice. Cumulative Climate Climate Bond Certifications passed USD100bn market milestone in early December 2019.
Sean Kidney, CEO, Climate Bonds Initiative:
“2019 results and 2020 estimates bring the vital international milestone of $1trillion in annual green investment by 2021/2022 into sight.”
“Acceleration into trillions of annual investments to support transition, adaptation and resilience must become the hallmark of the new decade.”
“We need multiple sovereign green issuances by governments; decisive action from central banks and regulators, institutional investors de-risking and realigning investment strategies towards zero-carbon; banks and insurers greening their portfolios; and global corporations committing to the Paris goals and TCFD. These will be the signs of market maturation and the financial sector driving capital re-allocation in the 2020s to face the climate emergency.”
Additional Data Global & China
Climate Bonds Initiative will be releasing a full analysis of the USD255bn of global green issuance in our forthcoming 2019 Highlights report scheduled for end January 2020.
Total 2019 China green issuance under domestic regulations is over USD53bn (equivalent), with USD30.1bn of those bonds aligned with international definitions and reporting rules, hence counted in the Climate Bonds annual totals. Climate Bonds in conjunction with China Bonds will be releasing a full analysis of all Chinese green issuance in our forthcoming China 2019 report in Q1 2020.
<Ends>
For more information:
|
Head of Communications & Media, Climate Bonds Initiative (London) +44 (0) 7914 159 838 |
Communications & Media Officer, Climate Bonds Initiative +44 (0) 7593 320 198 |
Notes for Journalists:
About the Climate Bonds Initiative: Climate Bonds Initiative is an investor-focused not-for-profit, promoting large-scale investment in the low carbon economy. Climate Bonds undertakes advocacy and outreach to inform and stimulate the market, provides policy models, government advice, market data and administers an international Standard & Certification Scheme for best practice in green bond/loan issuance. More information on our website here.
Sovereign Green Bonds: Poland, France, Nigeria, Fiji, Belgium, Ireland, Lithuania, Indonesia, Republic of Seychelles, Hong Kong SAR, Netherlands and Chile have all issued sovereign green bonds.
Climate Bonds Green Bond Database Methodology (English & Chinese): Climate Bonds Initiative uses a transparent set of criteria to define green bonds as eligible for its Green Bond Database. More detail on the classification criteria and screening process is set out in our updated green bond database methodology.
Tables and Charts: Tables 1-5 and Figures 1-2 see below:
Figure 1: Global Annual Green Bond Issuance CY 2015-2019
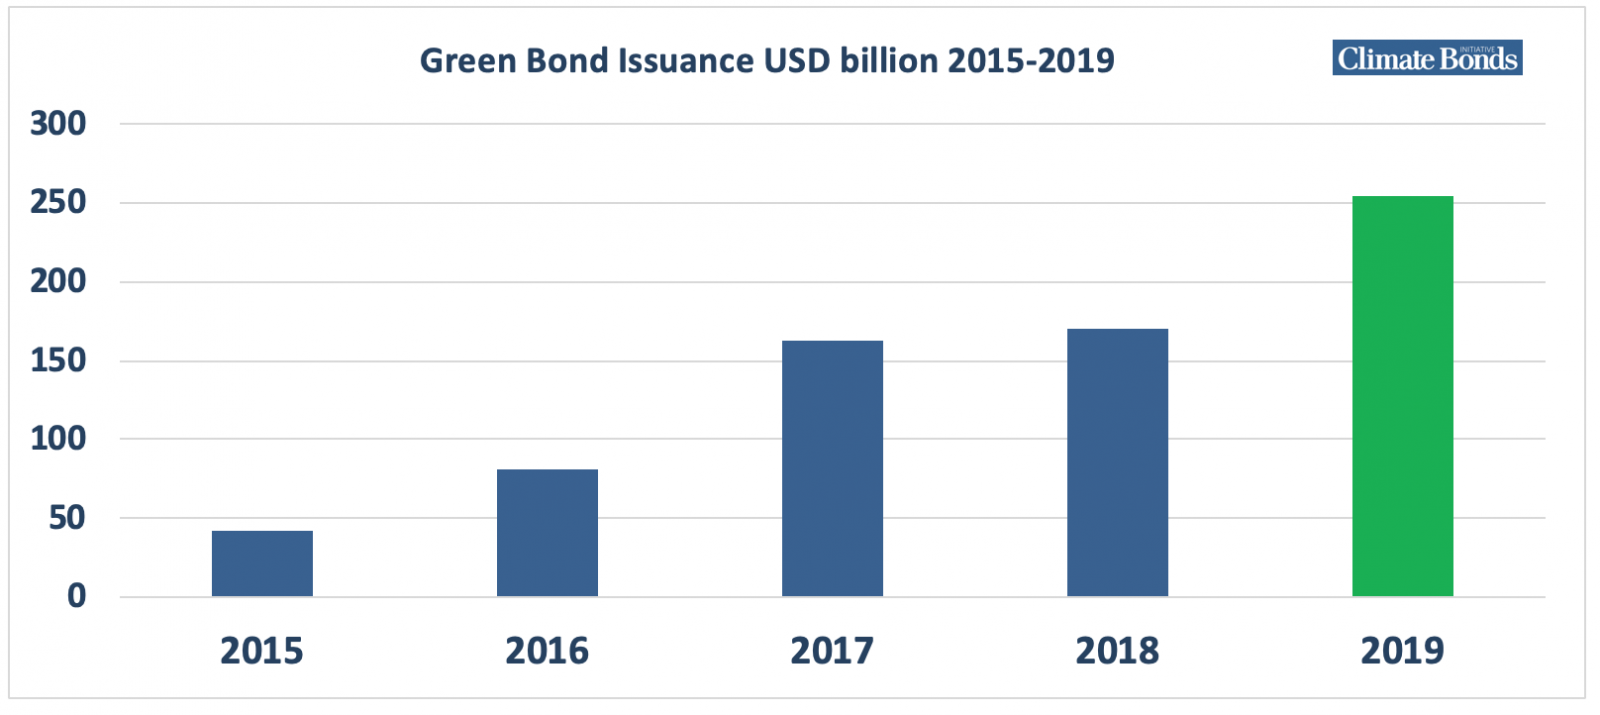
Figure 2: Green Bond Issuance by largest global economies CY 2019
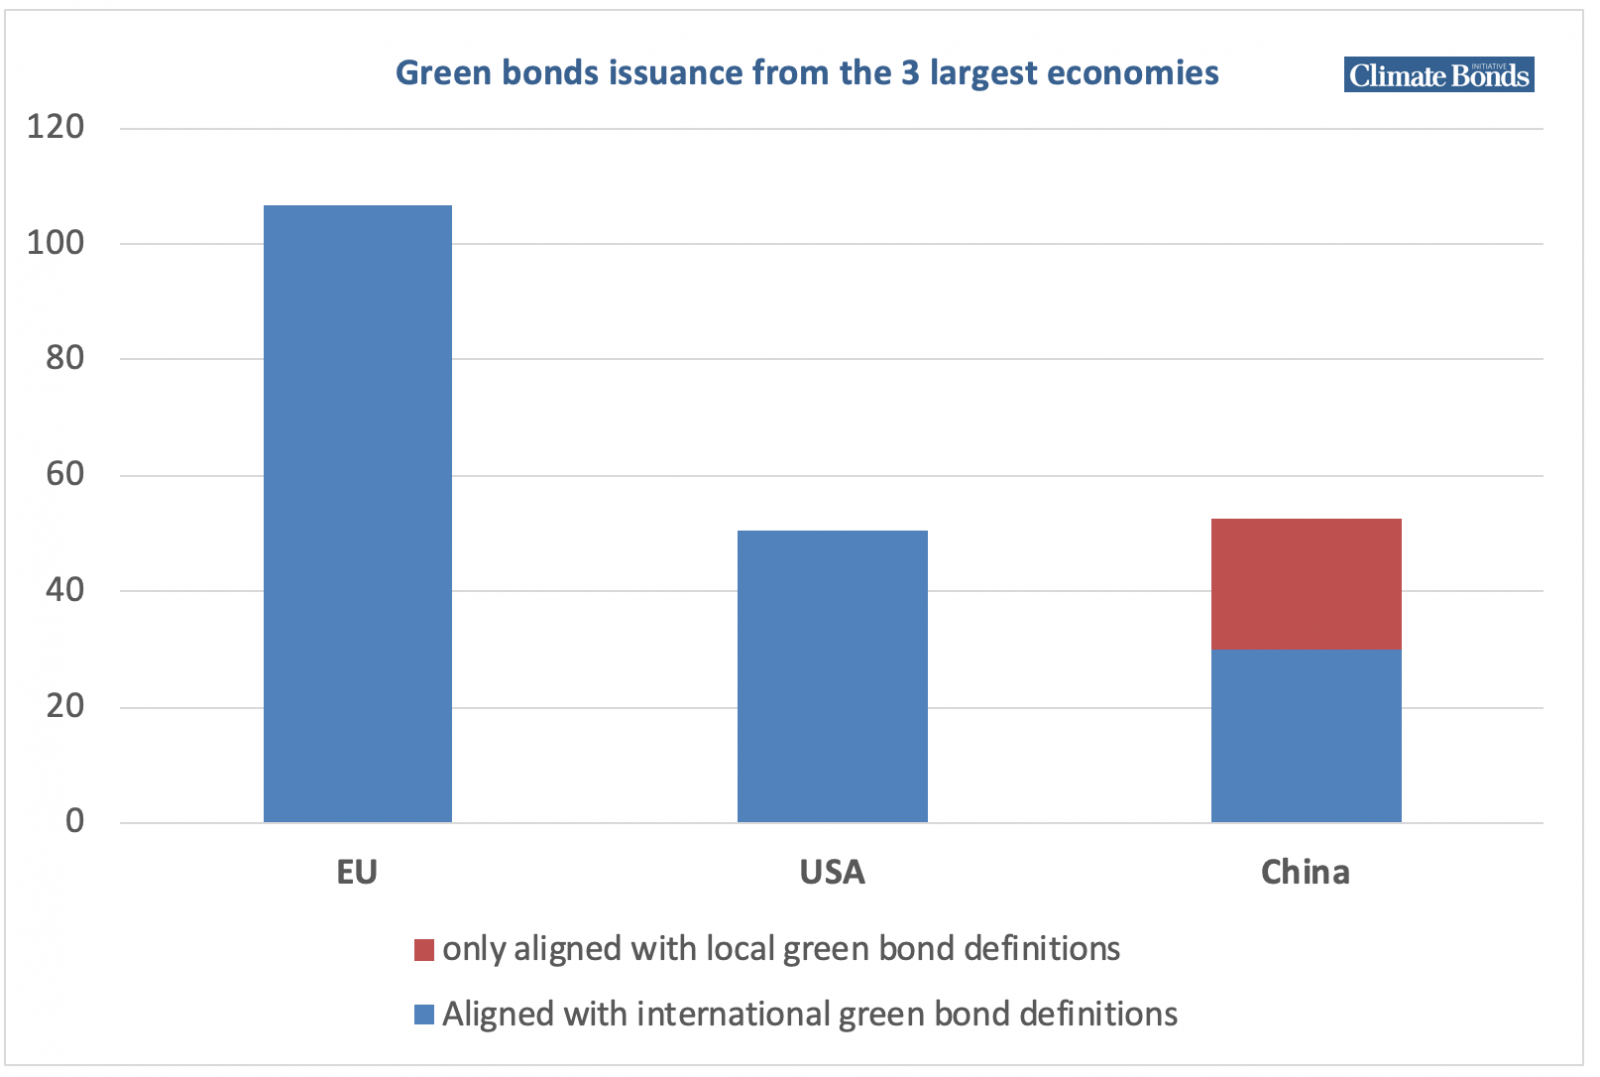
Figure 3: Top 20 2019 Green Bond Issuance by country at 31 December 2019
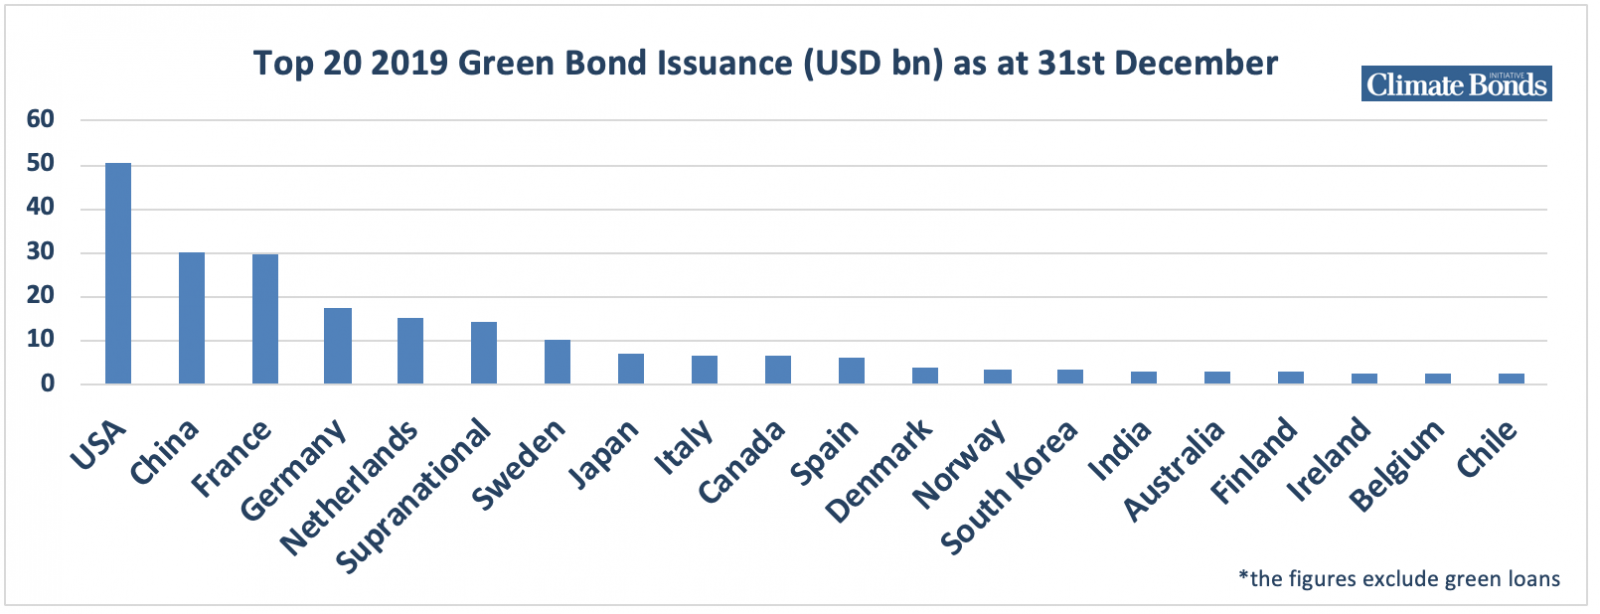
Figure 4: CY 2014 -CY 2019 Green Bond and Green Loan Issuance by individual sector
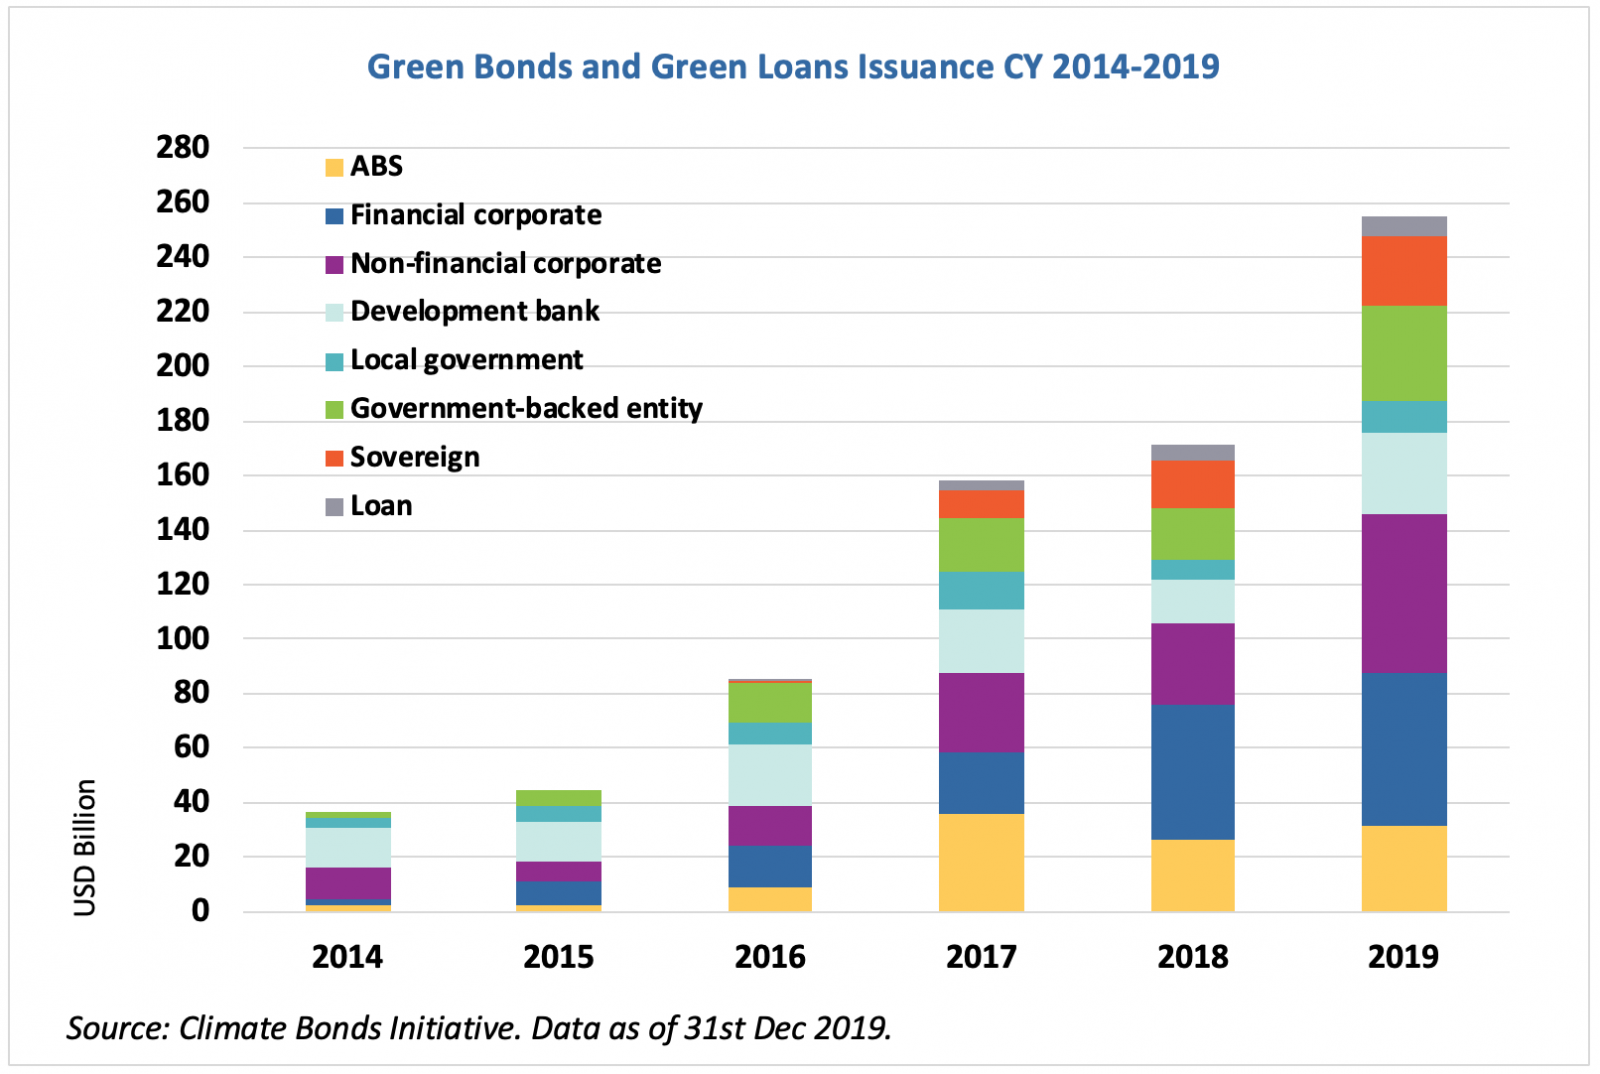
Figure 5: Use of Proceeds Breakdown CY 2019 (USD255bn) at 31st December
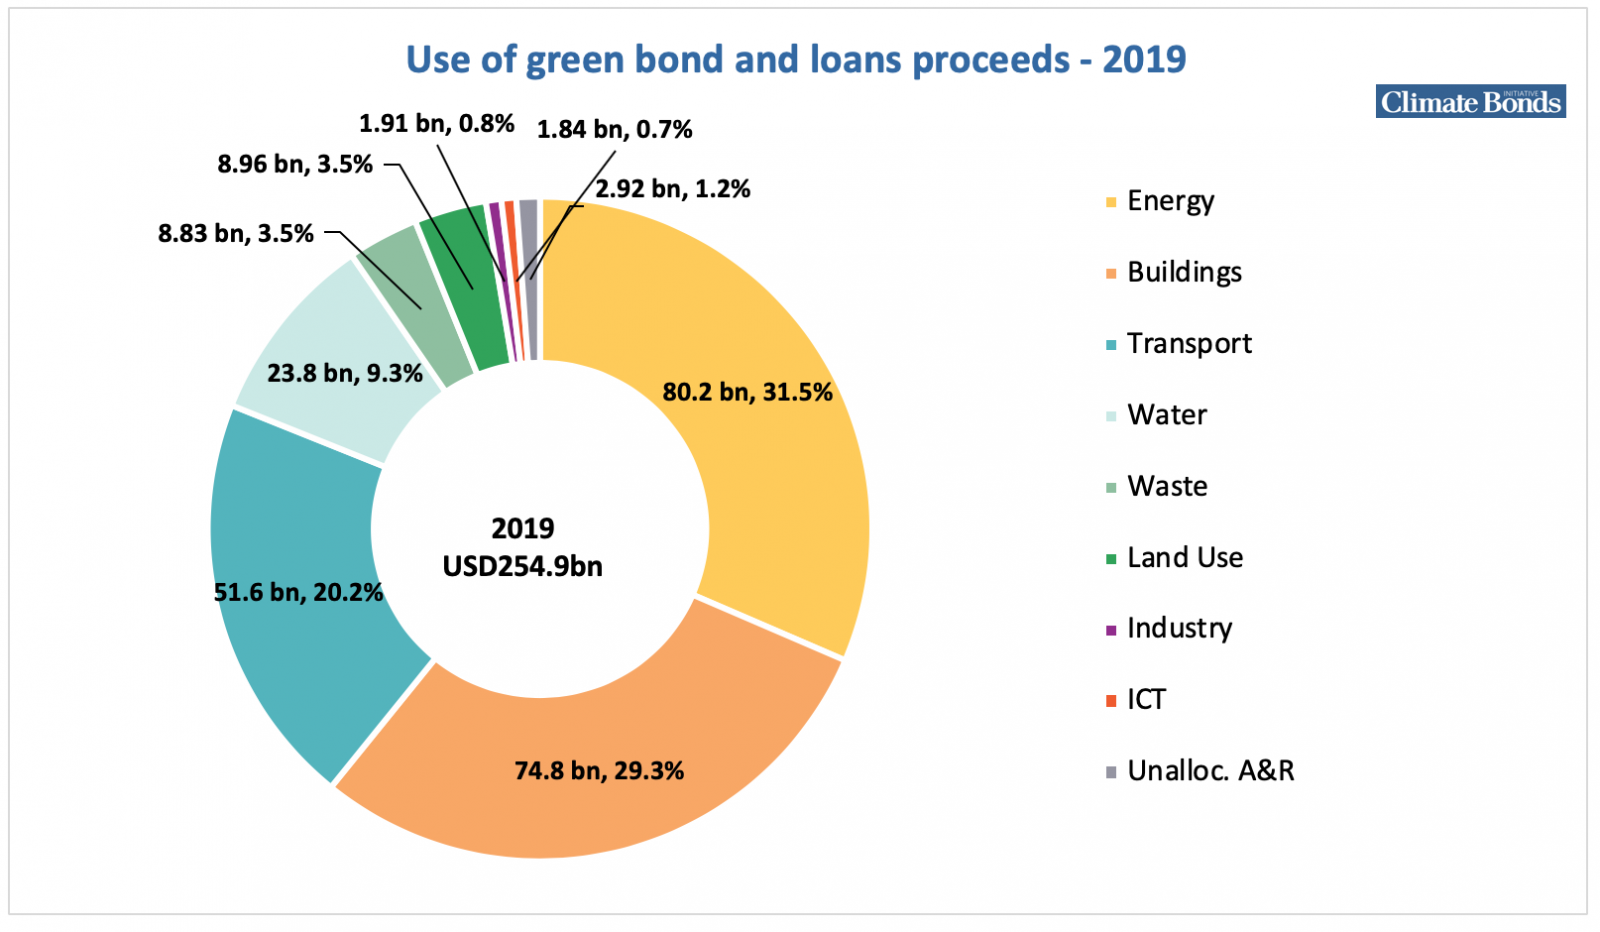
Table 1: Top 5 largest green bond issuers CY 2019 at 31st December
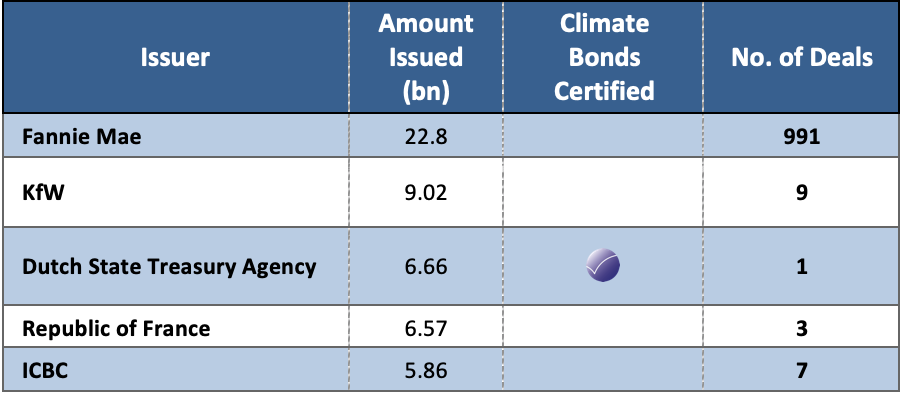
Table 2: Top 10 largest CY 2019 individual Green Bond/Loans at 31st December
<ENDS>