New Interactive Data Platform: An easy tool for anyone wanting to analyse sustainable debt markets across multiple parameters
Climate Bonds is pleased to launch an exciting new market intelligence tool. The Interactive Data Platform offers users a comprehensive breakdown of data across the three sustainable debt themes: Green, Social and Sustainability.
At the heart of our organisation’s mission is our remarkable data capacity and the firm belief that the expansion and sharing of this data can support the market's development. Our data collection is founded on the Green Bond Database Methodology, distinctive in its adherence to international science-based climate targets - and this is supported by the recent expansion to Social & Sustainability bonds (via a separate database and methodology).
Interactive Data Platform
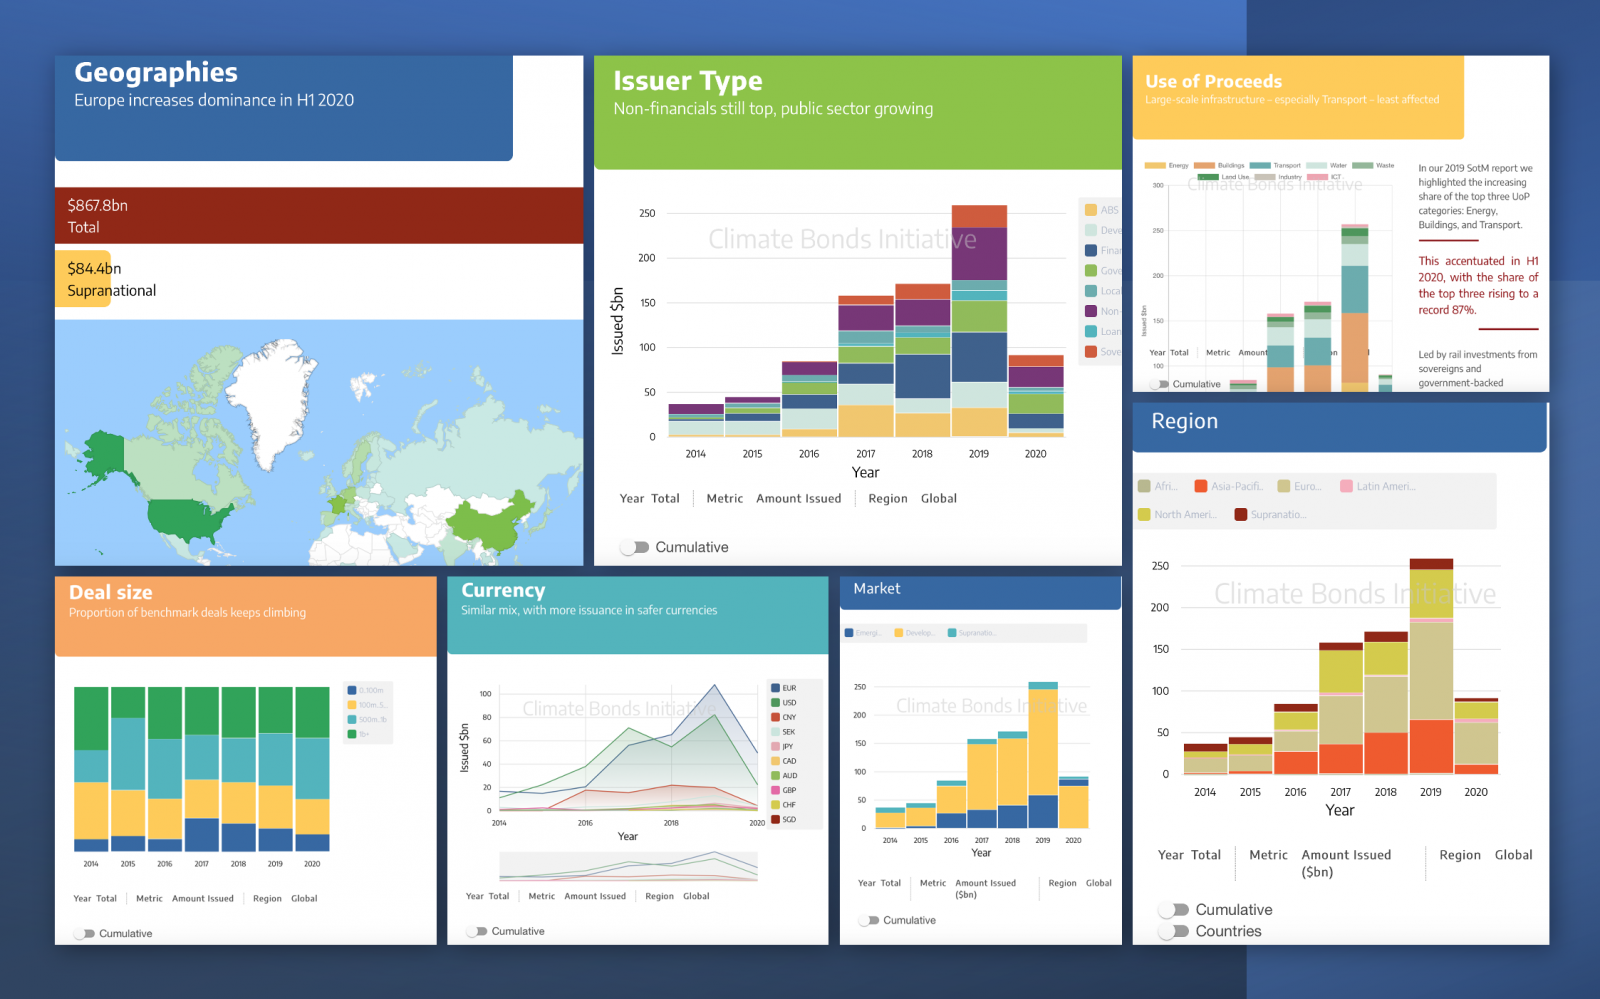
Climate Bonds' Interactive Data Platform is the first sustainable debt data tool of its kind. It allows users to analyse various aspects of the market by applying data filters and generating interactive charts.
Search the sustainable debt market by Theme, Geography, Issuer Type, Use of Proceeds, Currency, Deal Size and much more!
How it works
 The Platform consists of interactive charts that respond to the data filters selected on the left. The filters cover the following:
*Social and Sustainability data is preliminary (beta version), and only shown for amount issued. It also does not include the breakdown of Use of Proceeds. Pandemic bonds are included under Social (see our Sustainable Debt Global SotM 2020 and H1 2020 reports for more detail).
The default selection is what we would consider the 'standard' level of analysis, i.e. Year = Total, Metric = Amount Issued, Region = Global. The ‘Reset’ button takes you back to this.
When Year = Total, ‘Cumulative’ toggles are included below each chart. These allow you to aggregate yearly into cumulative data.
When Metric = Number of Deals, the data is heavily skewed due to Fannie Mae, a very frequent issuer of relatively small green MBS deals since late 2016. The notes below the map and region chart therefore provide the number of deals from Fannie Mae for reference, as well as more details about this issuer.
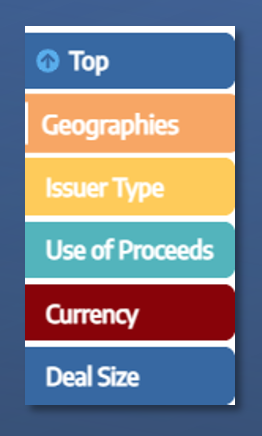
To view the different interactive charts on Geographies, Issuer Type, Use of Proceeds, Currency and Deal Size, you can click the sliding buttons as seen here or just scroll down on the page itself to each chart and apply your filters to view customised data.
Chart data can be downloaded in csv format. If you wish to obtain more granular and/or deal-level data (paid), please get in touch.
The Last Word
Here at Climate Bonds Initiative, collecting and presenting market intelligence rests at the core of our endeavours.
Our growing data capacity has enabled us to produce several series of respected reports, such as our State of the Market and Green Infrastructure Investment Opportunities publications. Moreover, our regular blogs provide insightful narratives on the journey of the Green Bond Market.
The inception of our Green Bond Database Methodology marked our intentions to lead market intel with an affinity to truly green transactions. To quell fears of greenwashing in these markets, science-based understanding has founded our every effort.
Now, our market analysis is broadening to reflect the breadth of debt instruments closely associated with green bonds. Our Interactive Data Platform is a grand product of our market intelligence and is at your fingertips at no cost!
With many ongoing and upcoming market developments in the world of sustainable finance, there has never been a better time to offer up our resources - and there has never been a better time for you to get closer to the data.
Climate Bonds
The data currently has an H1 2021 cut-off (the same as our latest Sustainable Debt Highlights H1 2021 report). We plan to update this at least on a half-yearly basis.
The Interactive Data Platform is a free tool but access to the underlying deal level data in our Database is only available to Data Partners. Please get in touch with partnerships@climatebonds.net to obtain more info.
For a detailed explanation of our green bond data and screening process, please see the Green Bond Database Methodology. The Social & Sustainability Bond Database Methodology will be available soon.
For all other data enquiries please email dataenquiries@climatebonds.net.
