Comprehensive review of green markets & global trends in 2019, part of a new annual series
Climate Bonds has released the Global Green Bonds State of the Market 2019 report.
This is the first of a new annual series analysing each calendar years market developments in detail including global trends in green bond, loan and sukuk issuance and avenues for market growth.
Market Highlights 2019
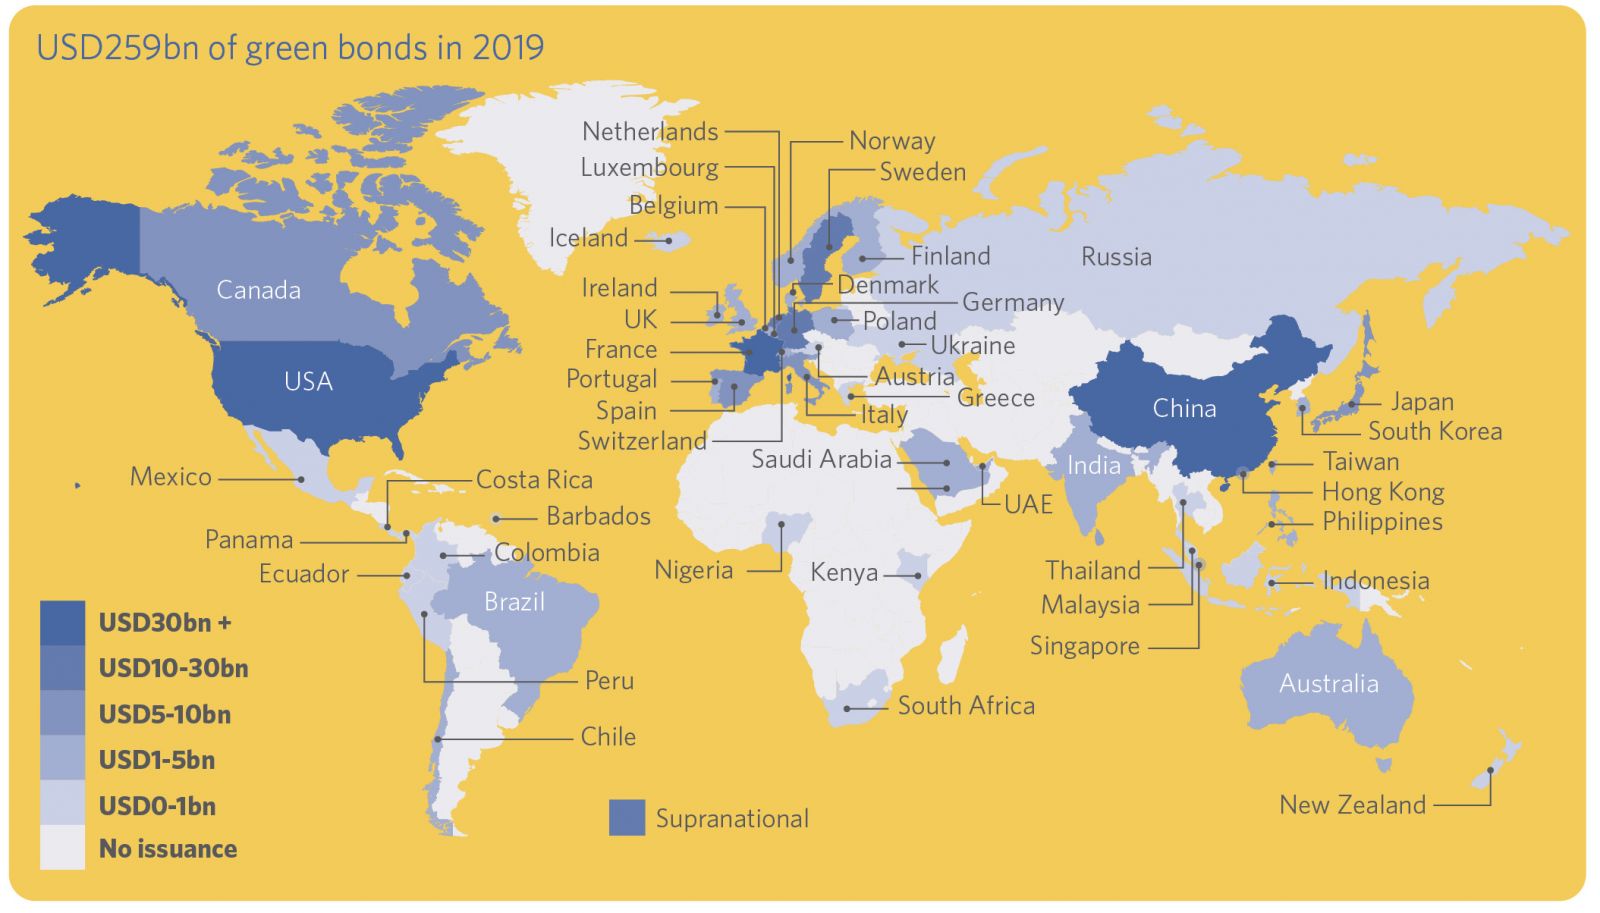
- Issuance: USD259bn (2018: USD171.2bn)
- Number of deals: 1,802 (2018: 1,591)
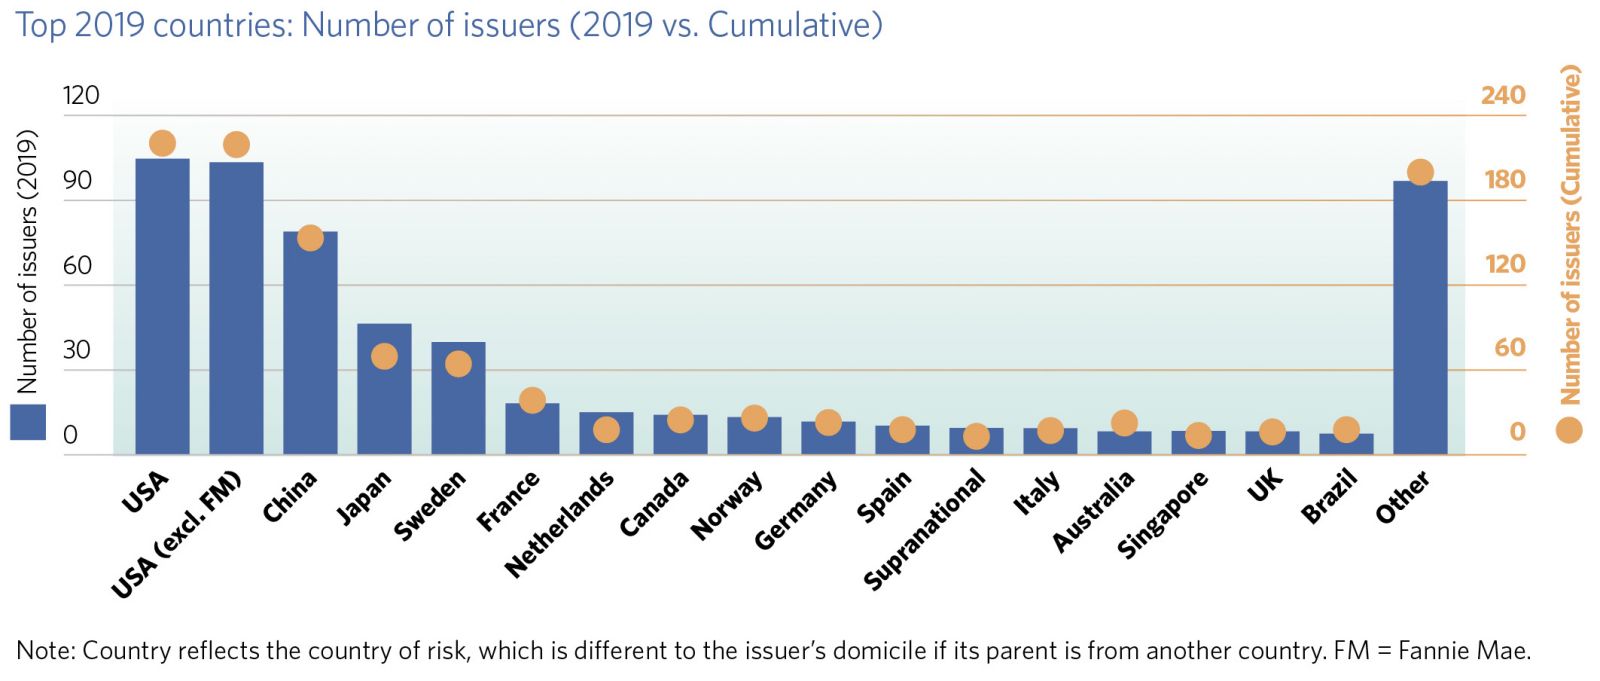
- Number of issuers: 506 (2018: 347)
- Number of new issuers: 291 (2018: 204)
- New countries: 8 (Russia, Saudi Arabia, Ukraine, Ecuador, Greece, Kenya, Panama, Barbados)
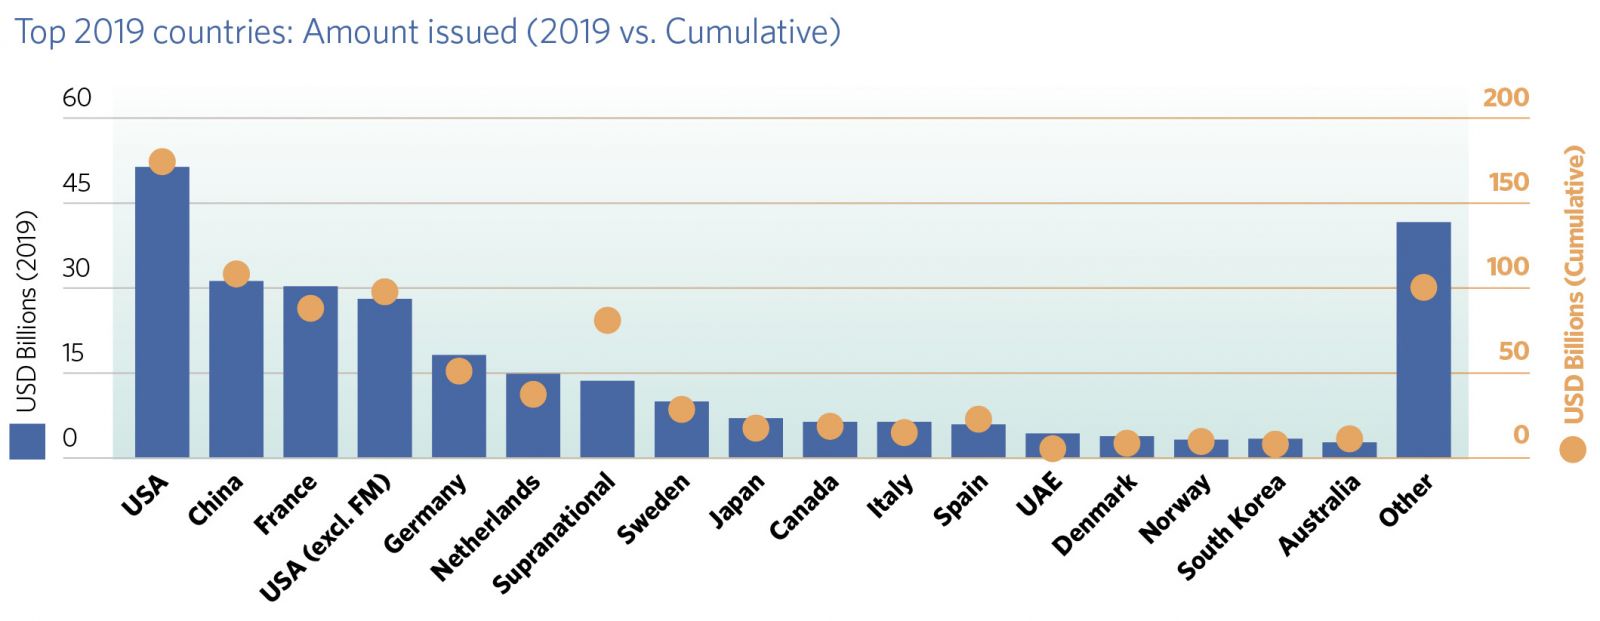
- USA top with USD51.3bn, China (USD31.3bn), France (USD30.1bn)
- 86% of the amount issued had some form of external review in 2019
- Certified Climate Bonds pass USD100bn milestone
Cumulative market size since inception to end 2019
- Issuance: USD754bn
- Number of deals: 5,931
- Number of issuers: 927
Regional Issuance 2019
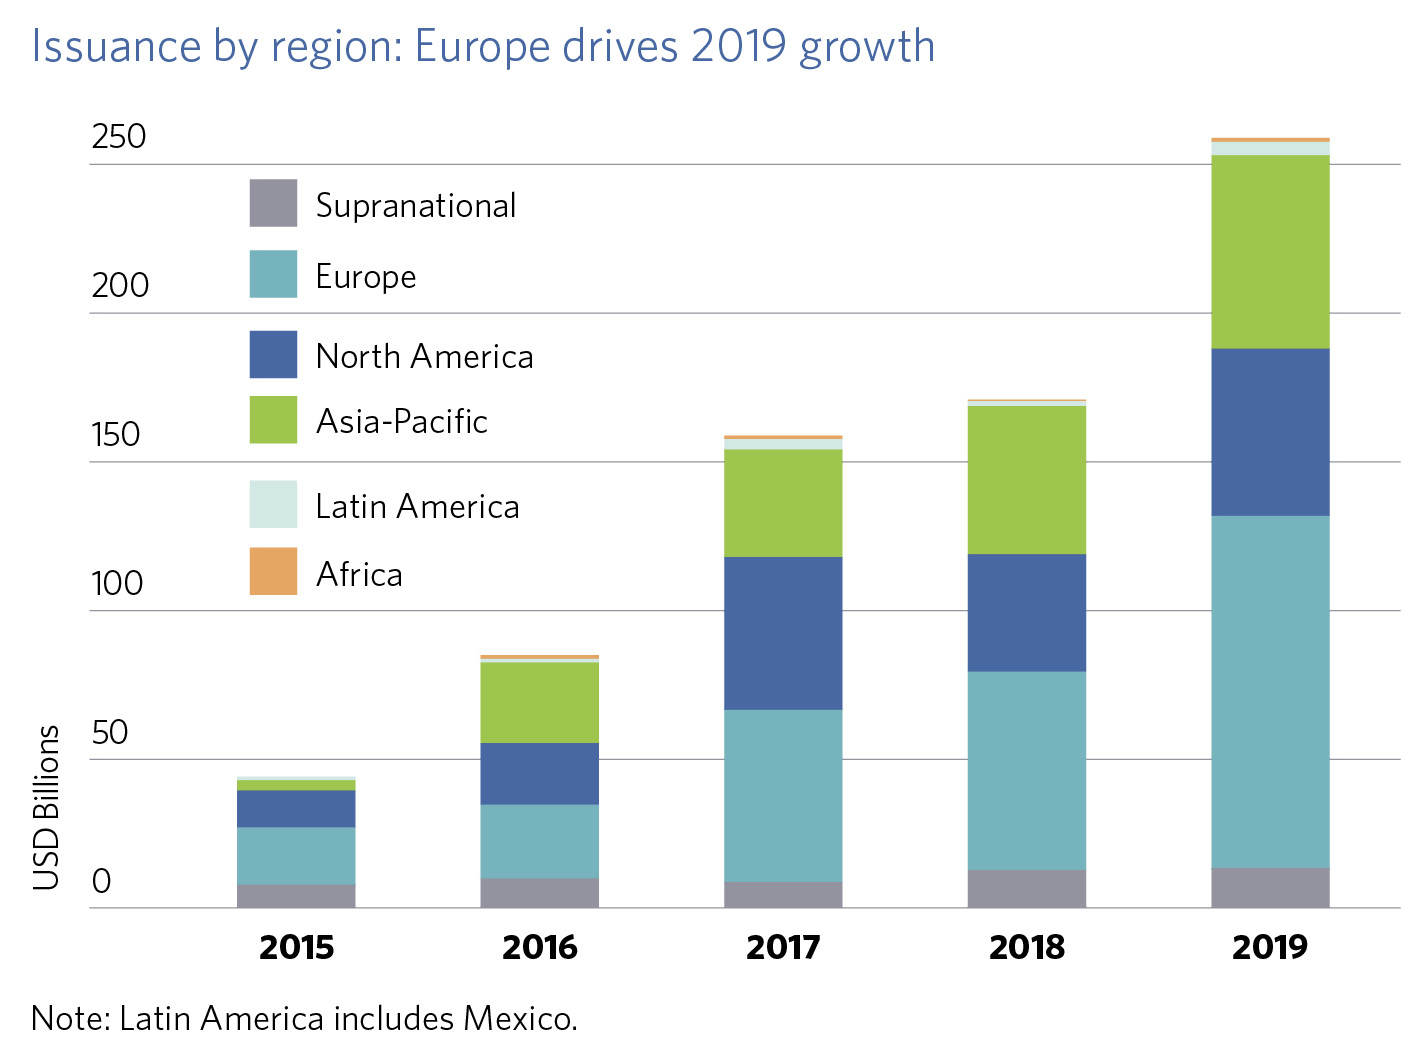
Europe experienced the largest increase, with an added USD50bn vs. 2018 representing 57% of the global expansion. This extends Europe’s regional lead in cumulative volumes to over USD100bn more than North America and Asia-Pacific, which are respectively in second and third place.
For the first time ever, 2019 saw Asia-Pacific achieve the second-highest regional volume in consecutive years (previously 2018 and 2016), with corporates accounting for almost 60% of this. Even so, APAC’s 29% increase was smaller than North America’s 46%, so the difference between the two regions was smaller in 2019 than 2018.
Elsewhere, Latin America and Africa both had their best years yet, respectively rising three-fold to USD4.7bn and six-fold to USD898m (vs. 2018).
Overall, the share of developed markets (DM) grew from 69% in 2018 to 72% in 2019, with that of EM falling slightly from 24% to 23%. Supranationals experienced a drop, from 7% to 5%.
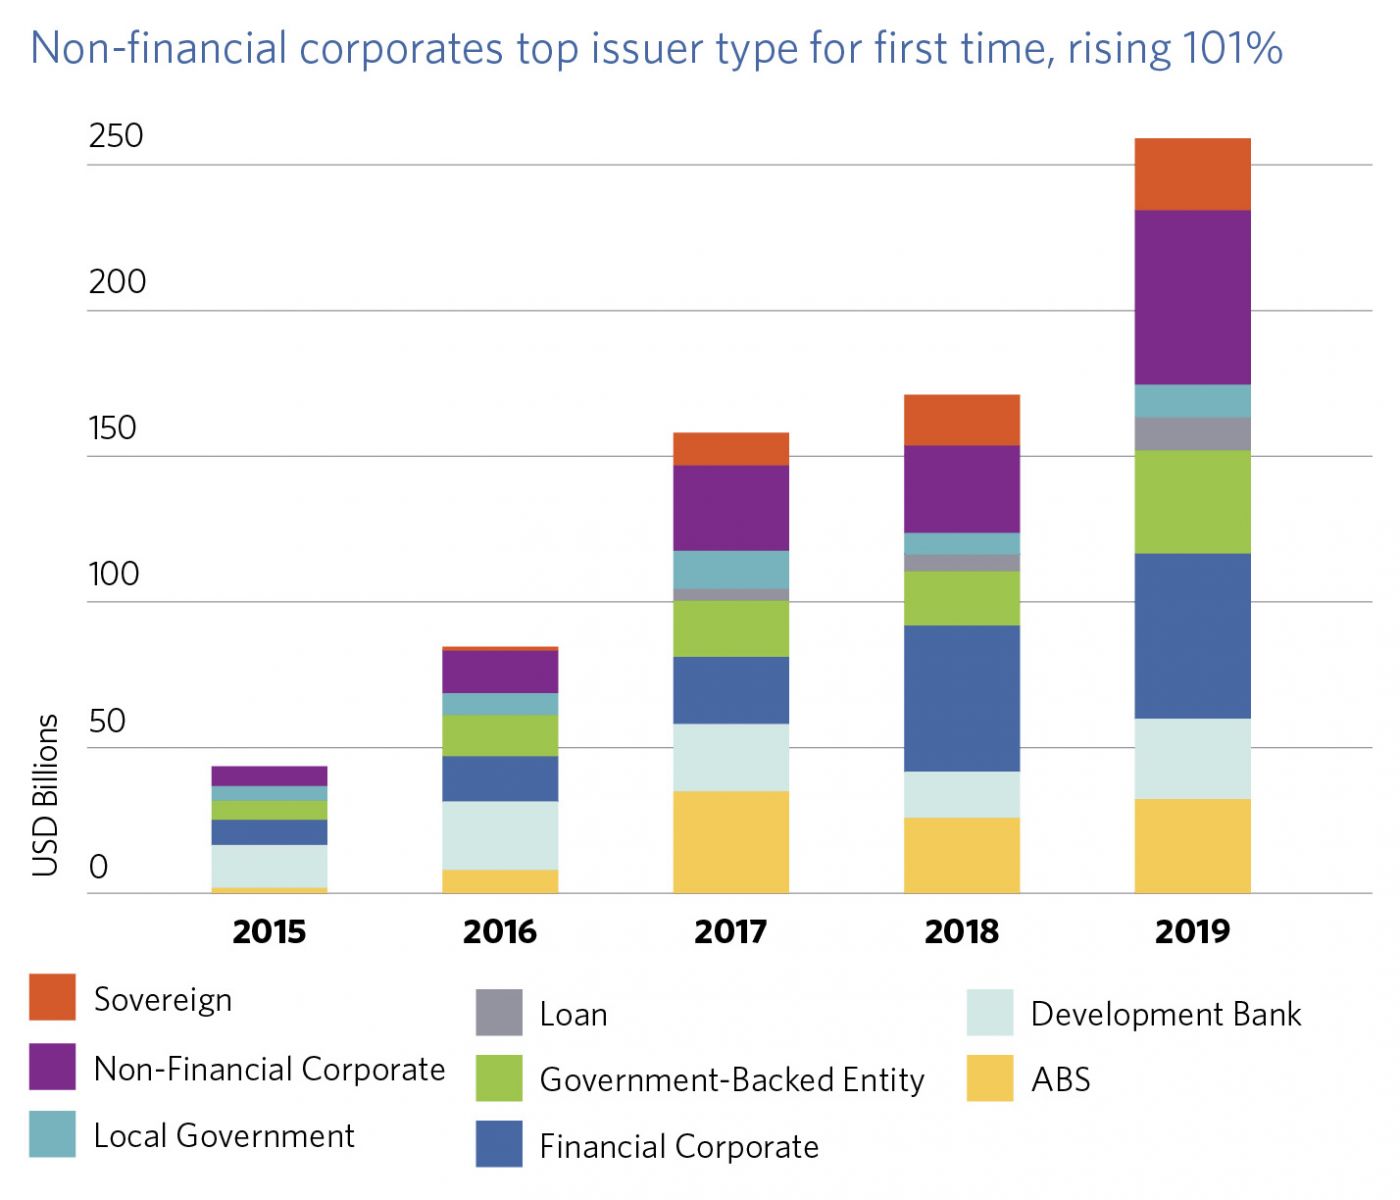
Issuer types: Non-financial corporates fuel growth
Within private sector issuance, non-financial corporates performed particularly well, topping the issuer type ranking for the first time. Their issuance more than doubled to USD59.1bn, overtaking financial corporates which only increased 12%, the least of all issuer types. This is a “reversal” of 2018, which saw financial corporates more than double in volume while non-financials stagnated. Meanwhile, green loans posted 98% growth.
Public sector issuance also rose robustly, with all issuer types apart from local governments reaching record volumes. Most of the increase was driven by government-backed entities – mostly European – and development banks, with both almost doubling in size.
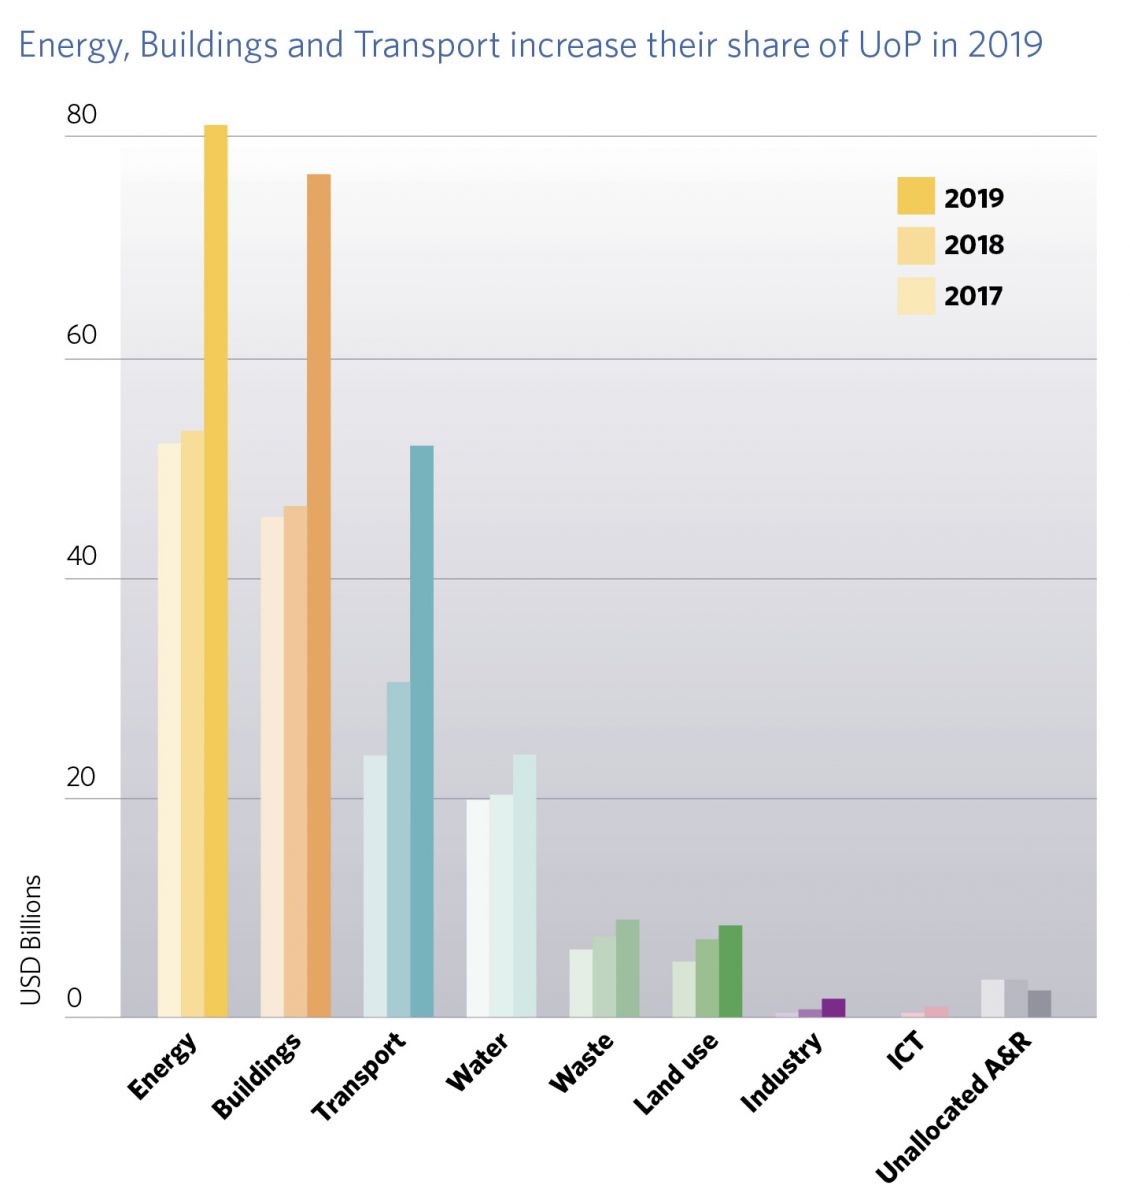
Use of proceeds: Top 3 categories account for over 80%, an increasing share
While allocations rose across the board, the top 3 categories – Energy, Buildings and Transport – were the strongest performers, accounting for USD80bn of the overall USD88bn added.
Buildings saw the largest absolute year-on-year increase (+USD30.1bn), closing the gap with Energy, while Transport was highest in relative terms with +71%. At 82%, their combined share reached the highest level since 2015 (77% in 2018).
Water, Waste and Land use experienced more moderate growth. Water (+18%), which almost doubled in 2017 but was flat in 2018, has cemented itself as the fourth largest category. Waste (+17%) and Land use (+17%) continued the steady rise of the last few years but have yet to reach USD10bn in annual volume.
Currency: Share of EUR rising, USD flat, CNY falling
The share of the top 3 currencies – EUR, USD and CNY – reached a peak of 90% in 2016 and has been declining since, totalling 81% in 2019.
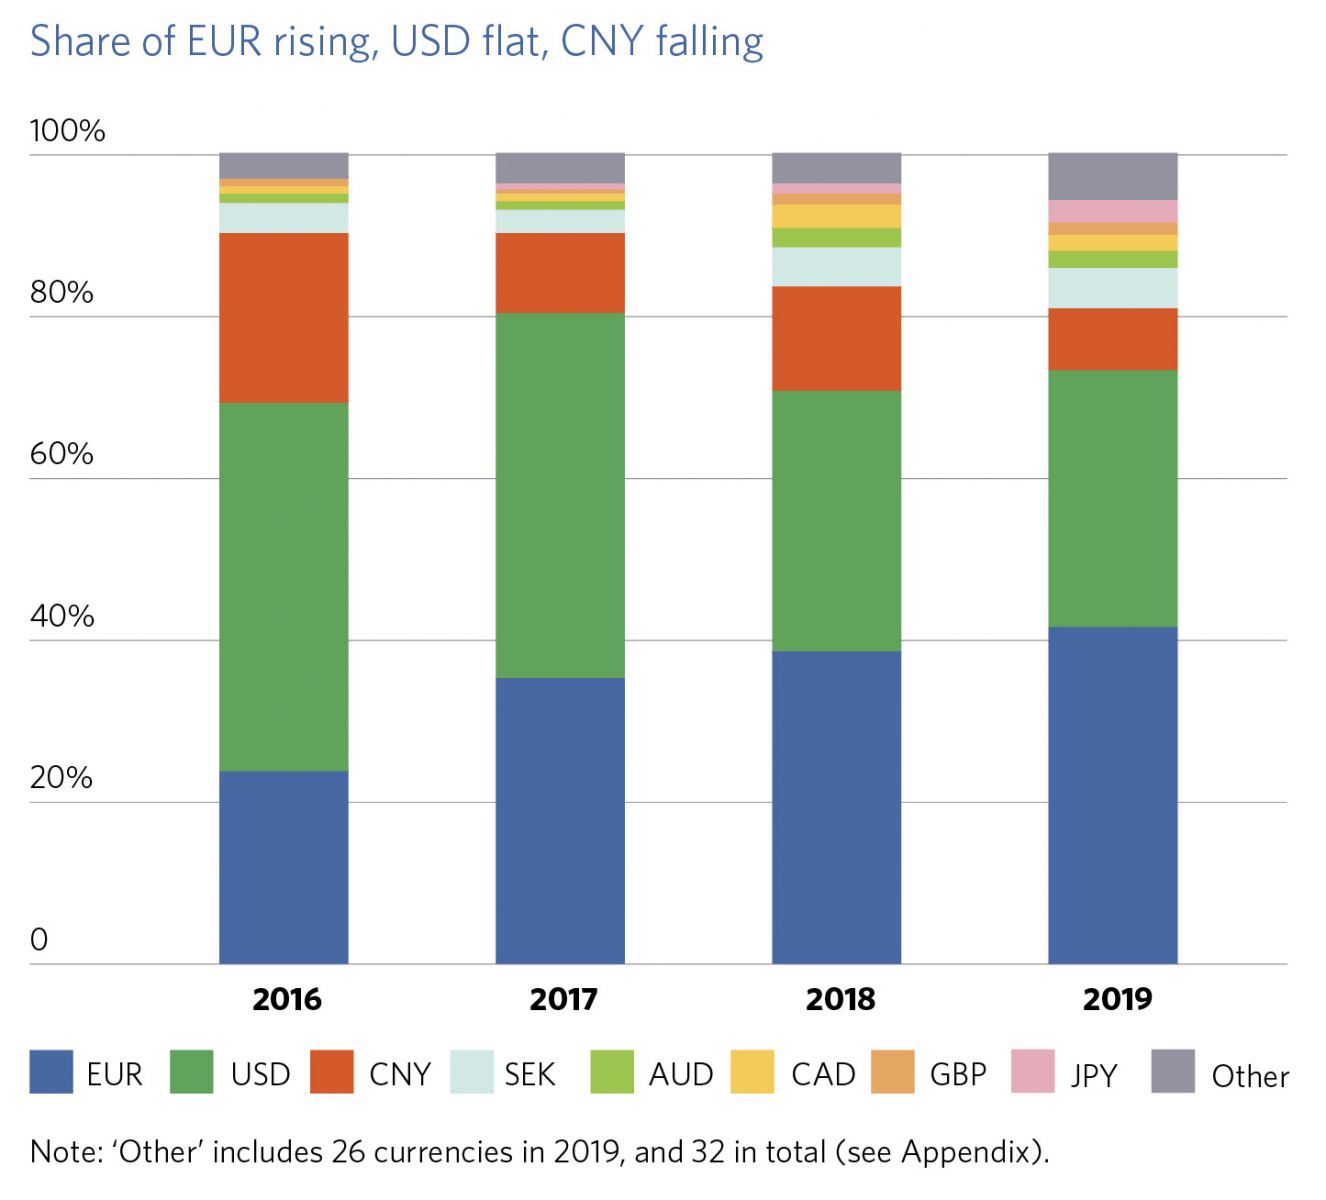
However, the EUR has been growing robustly in both volume and share over the last five years. With USD108bn in 2019 (first time a currency has passed USD100bn in a single year), the EUR overtook the USD in cumulative volume, reclaiming the lead it had lost in 2015.
More broadly, the top eight currencies have remained the same in the last few years, with denomination in SEK and JPY growing particularly fast. The share of hard currencies was 83% in 2019, in line with the cumulative total of 82% and between the 80-85% range of the last three years.
2019 saw denomination in four new currencies: DKK (two deals, USD902m), CZK (one, USD52m), KES (one, USD41m) and BBD (one, USD1.5m). A total of 34 currencies were used during the year.
Outlook for H2 2020 – 2021
- Green bond growth expected from financial institutions, sovereigns, and climate-aligned issuers
- Greater use of other labels (e.g. sustainability and social bonds), especially in light of COVID-19, as well as performance-linked instruments (e.g. KPI-linked credit facilities) to facilitate transition
- Increased focus on transitioning “brown” or “grey” sectors, such as aviation, steel, chemicals and cement
- Harmonisation of taxonomies, especially around the EU Taxonomy, green bond guidelines and disclosure
- Certification growth as Climate Bonds Standard expands in reach and more repeat issuers adopt Programmatic Certification
2020-21 green investment picture and the wider labelled universe
The impacts of COVID-19 on the 2020 global labelled debt market have already been significant.
Green bond issuance has dropped considerably in the first half of 2020 as some issuers opt to put their deals on hold amid uncertainty in the capital markets, while others choose to re-label their bonds more broadly as ‘sustainability’ or ‘SDG’ bonds in order to incorporate social dimensions, including health. Some, especially public sector issuers, have ramped up issuance under strictly social labels at the detriment of green ones.
Against this backdrop, a view of the wider labelled debt market is becoming increasingly important. While maintaining our focus on green finance and climate solutions, Climate Bonds is also developing a separate database for other sustainable debt labels, with its own methodology and reporting.
In early September, we intend to publish the first iteration under this fresh format: an interim H1 2020 report which will include analysis of both the green bond market and other debt labels. In addition, we will feature a section discussing the evolution of the market and developments in harmonisation and taxonomies.
More to come in later 2020...
‘Till next time,
Climate Bonds
