Climate Bonds Releases Green Bond Pricing Report for H2 2020
Greenium increasingly visible including German Sovereign Green Bund
London: 11/03/2021: 06:00 AM GMT: Climate Bonds latest Green Bond Pricing in the Primary Market H2 2020 reveals increasing signs of greenium in both public and private sector bond issuance in the second half of the year, including the performance of the inaugural German sovereign green Bund of September 2020.
The report highlights performance of the German twin bonds that provide a one-of-a-kind comparison as the German green Bund priced with a greenium, maintained a lower yield in the secondary market, and exhibited lower volatility compared to its vanilla twin.
Analysis reveals that on average, both EUR and USD green bonds achieved higher book cover and greater spread compression than vanilla equivalents and green investors were allocated a greater percentage of deals than ever on average, demonstrating that treasurers attach value to the diverse investor base that green bonds are known to attract. Yield curves were available for 33 bonds in our sample and 19 of those achieved a greenium.
USD bonds performed exceptionally strongly, as one would expect given the extraordinary dynamics in US markets during H2 2020. In the immediate secondary market, green bonds performed well, on average tightening more than comparable bonds and indices after both seven and 28 days, emphasising that green bonds can offer value to both issuers and investors.
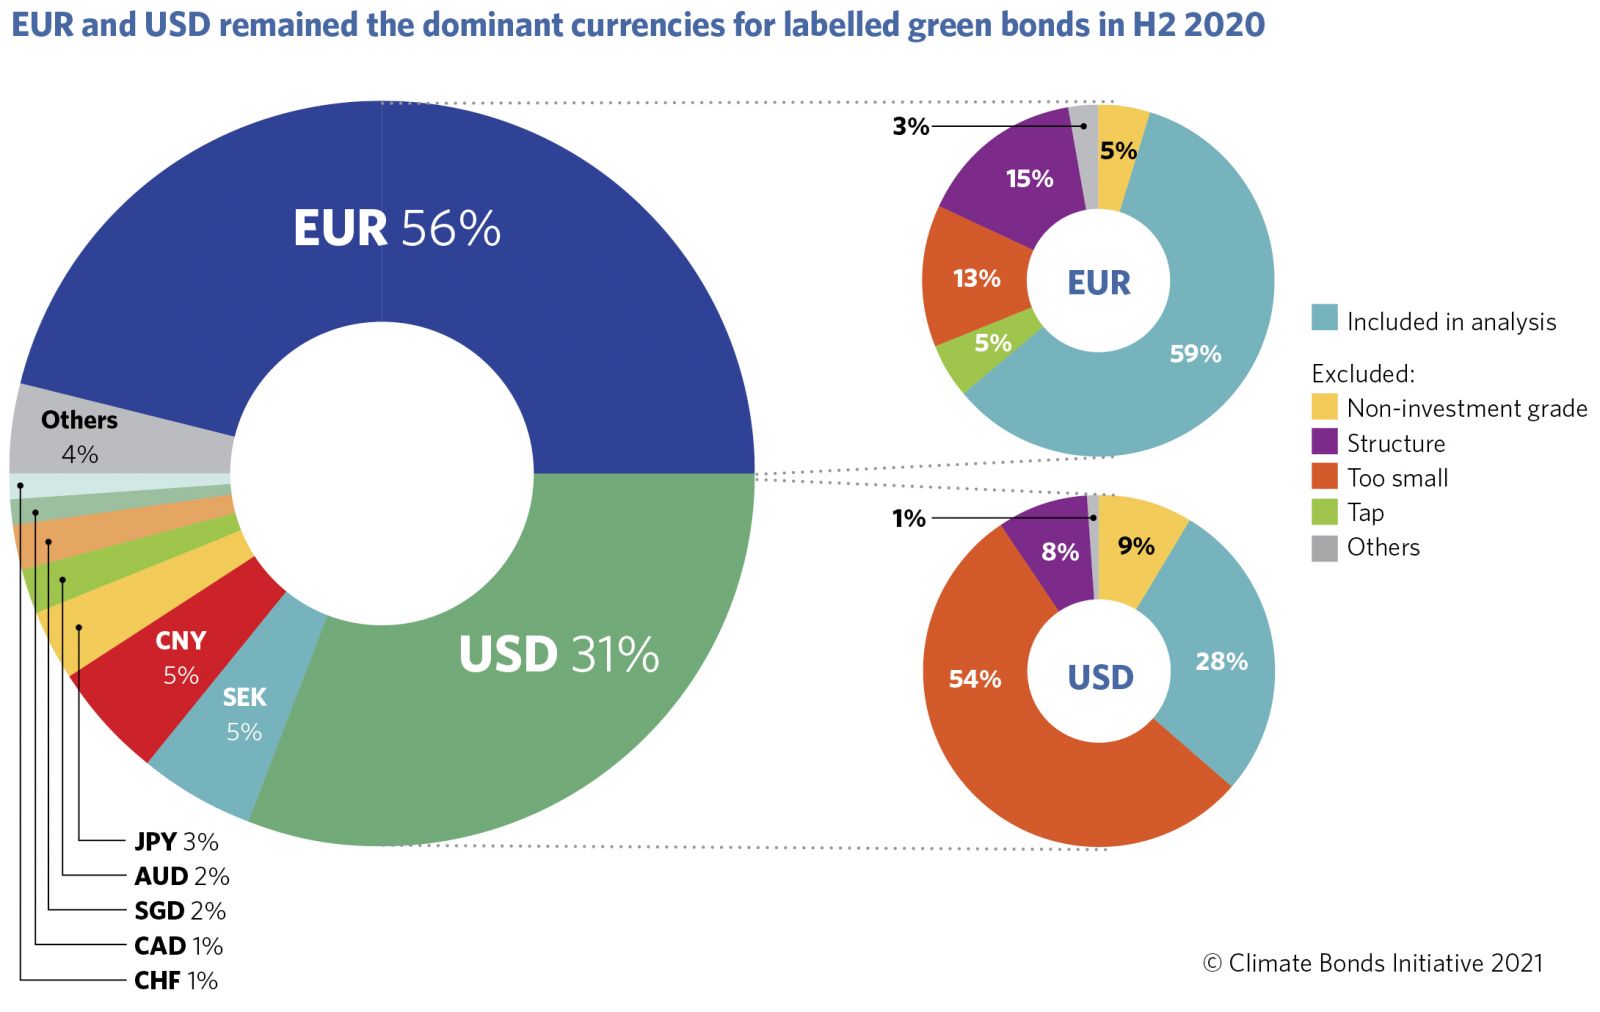
Now in its 11th iteration, Green Bond Pricing in the Primary Market H2 2020 monitored the performance of 35 EUR and 19 USD denominated benchmark size green bonds with a total value of USD62.5bn issued during July to December 2020, a period of rebound in the green bond market.
Highlights from Q3-Q4 2020:
- Report includes 54 green bonds with a combined face value of USD62.5bn issued between July and December 2020.
- Qualifying green bonds in EUR and USD performed well on all metrics in the primary and immediate secondary market, on average.
- 56% of green bonds were sold to green investors
- Green bond ETFs continued to report huge inflows during H2 2020
German Sovereign Spotlight:
- Germany’s unique twin bond structure demonstrates lower yields and volatility for green twins, drawing an initial conclusion that governments should be encouraged to prioritise green expenditure knowing it is relatively cheaper. (Figure 1)
- The German green Bund priced with a greenium, maintained a lower yield in the secondary market, and exhibited lower volatility compared to its vanilla twin. The Bobl priced with a greenium and maintained a lower yield in the secondary market compared to its vanilla twin, but the volatility was less conclusive.
- Nevertheless, this is clear evidence that investors attach a premium to the green label, offering cheaper financing to Debt Management Offices, and shows that green bonds can provide a relatively more stable investment.
Detailed Findings:
- This research is based on bonds representing 35% of green bonds issued in H2 2020. 27 qualifying issuers revisited the green bond market with 31 bonds, while 20 debut issuers brought 24 labelled green bonds to market.
- Qualifying EUR and USD green bonds performed well during book building. EUR green bonds achieved, on average, higher levels of oversubscription and spread compression compared to vanilla equivalents.
- USD green bonds achieved higher average oversubscription than vanilla equivalents. Although the average spread compression was lower for green bonds, a larger number of green bonds achieved greater spread compression.
- Yield curves were built for 33 qualifying bonds. 19 of those priced inside their yield curves exhibiting a greenium, seven priced on the yield curve, and just five priced with normal new issue premia.
- Within the sample of 33 bonds, nine were USD denominated: eight priced with a greenium and one priced on the yield curve, consistent with the extraordinary dynamics seen in the USD credit markets in H2 2020.
- 56% of the bonds in our sample were allocated to investors describing themselves as green.
- Seven and 28 days after pricing green bonds had, on average, tightened more than vanilla baskets and matched indices suggesting that the momentum gained during book building continues to extend into the immediate secondary market with green bonds offering benefits for both issuers and investors.
- Green bond ETF’s reported another period of extraordinary growth in H2 2020. We expect this interest to remain robust as an increased focus on responsible investment will encourage more investors to incorporate green instruments into their investment strategies. (Figure 2)
- Auto sector issuers including VW and Daimler printed green bonds for the first time in H2 2020, driving off with strong pricing dynamics. We note that among the 90 auto companies with outstanding bonds, just ten had issued green bonds.
Sean Kidney, CEO, Climate Bonds Initiative:
“The evidence is mounting of the pricing benefits of green, from the German sovereign bonds through to green product in US and European markets. The wider implications, for sovereigns, corporates and banks are increasingly obvious. With the growth of green bond issuance, particularly in Asia-Pac and LATAM, we expect to see pricing signals emerge over time in regional markets.”
“Institutional Investors in every market want quality green products, from sovereigns and the private sector, and are seeing solid valuation and liquidity benefits compared to vanilla bonds in secondary markets. This means investors are increasingly willing to bid tighter at primary - a fundamental shift.”
François Millet, Head of ETF Strategy, ESG and Innovation at Lyxor Asset Management:
"Steady inflows to green bond ETFs in H2 2020 were driven by demand from wealth and asset managers stepping-up green bond allocation due to higher focus on climate as part of massive portfolio transformation to ESG. ETFs, which invest in largest investment grade EUR and USD issuances provide exposure to the most liquid segment of the market as covered by the report. These ETFs invest in the secondary market once the green credentials and index eligibility of new issuances have been verified. As listed funds holding broad baskets of green bonds, they bring an extra component to the green bond ecosystem, providing an additional layer of liquidity, while offering market access and instant diversification to all investors."
<Ends>
Report Launch Webinar:
Wednesday 17th March, 2021
10:45AM London / 11:45AM Paris / 18:45PM Hong Kong, Singapore
|
For more information: Head of Communications and Media, Climate Bonds Initiative +44 (0) 7914 159 838 |
For more information: Communications & Digital Media Manager Climate Bonds Initiative (London) +44 (0) 7593 320 198 |
Notes for Journalists:
About the Climate Bonds Initiative: Climate Bonds Initiative is an investor-focused not-for-profit, promoting large-scale investment in the low carbon economy. Climate Bonds undertakes advocacy and outreach to inform and stimulate the market, provides policy models and government advice, market data and analysis, and administers an international Standard & Certification Scheme for best practice in green bonds issuance. For more information, please visit http://www.climatebonds.net/.
Pricing series: The series began in 2016 and all of the reports can be found here.
Methodology: This paper includes labelled green bonds issued during H2 2020. Labelled green bonds meeting the following specifications are included:
- Announcement date between 01/07/2020 and 31/12/2020
- Currency: EUR or USD
- Benchmark size i.e., >= USD500m
- Investment grade rated
- Minimum term to maturity of three years at issue
- Consistent with the Climate Bonds Taxonomy and included in the Climate Bonds Green Bond Database
Amortising, perpetual, floating-rate, and other non-vanilla structures were excluded. These parameters are designed to capture the most liquid portion of the market while not limiting the diversity of data. All historical data is based on asset swap spreads for EUR denominated bonds. USD bonds are compared to a US treasury curve. All historical data is from Refinitiv EIKON.
Comparable baskets include bonds issued in the same quarter as the subject green bond. Comparable bonds must fit the parameters described above except that they are not labelled, and the use of proceeds is not explicitly green. Baskets comprise the closest possible matches based on the following considerations in order of priority: a) currency, b) market type (EM/DM/Sukuk), c) no other thematic label d) seniority e) maturity, f) credit rating and g) sector, among bonds issued in the same quarter.
If corresponding bonds cannot be found, best efforts are made to find suitable alternatives from the available sample. The resulting baskets are a proxy for how the money could have been invested in the same quarter in which the green bond was issued. The number of bonds in each basket ranges from one to four bonds.
We acknowledge that bonds behave differently depending on when they are issued and that geopolitical events can affect bond prices from one day to the next. This proxy was designed to circumvent the fact that vanilla bonds and green bonds with similar characteristics are rarely issued on the same day.
Acknowledgements:
Support and funding for this paper were kindly provided by Lyxor.
Suggested citation:
Harrison, C., Green Bond Pricing in the Primary Market H2 2020, Climate Bonds Initiative, March 2021
Figure 1: German Sovereign Volatility Comparison
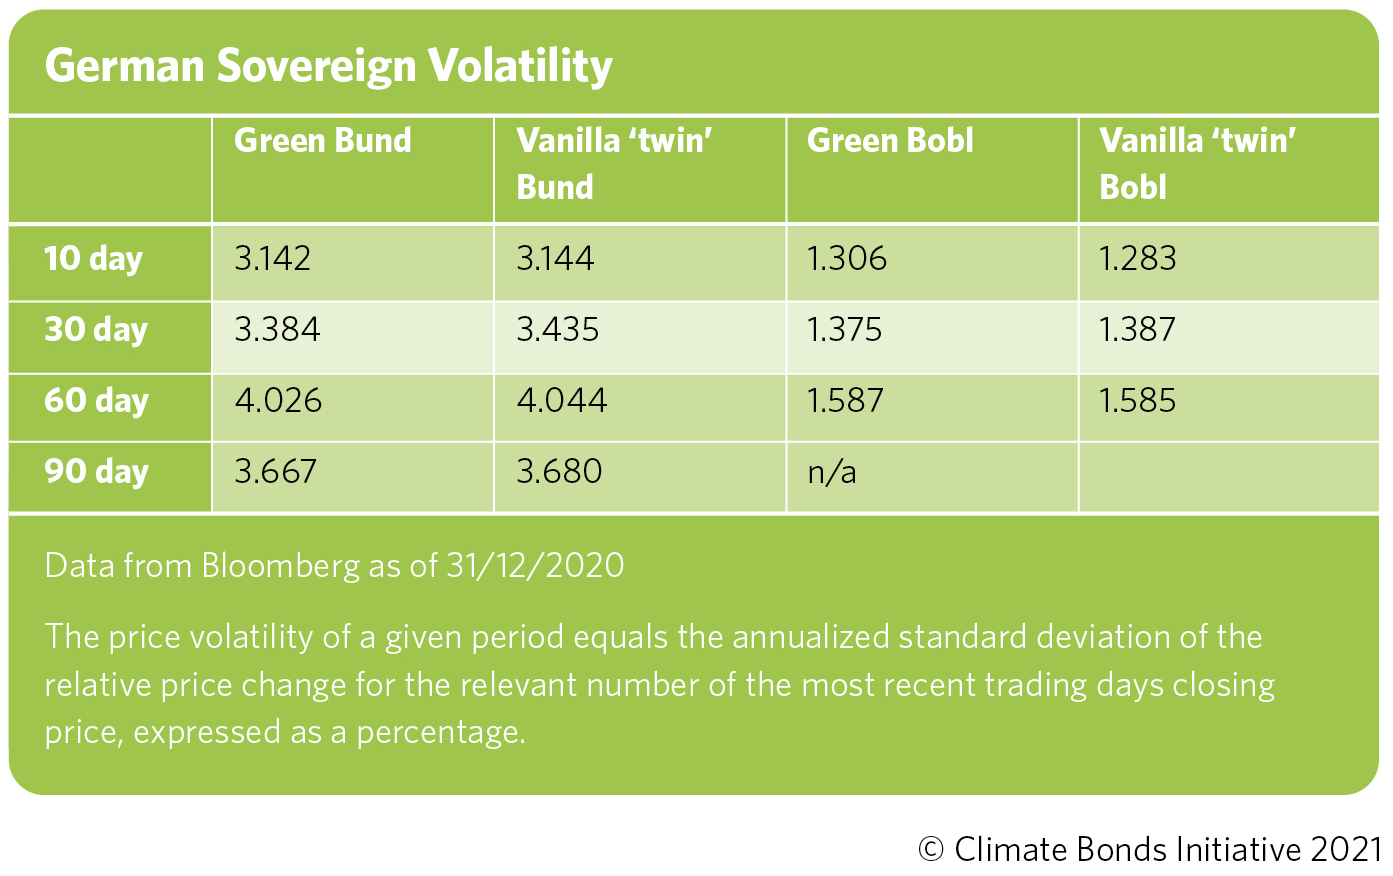
Figure 2: ETF Growth Dec 2019 – Dec 2020
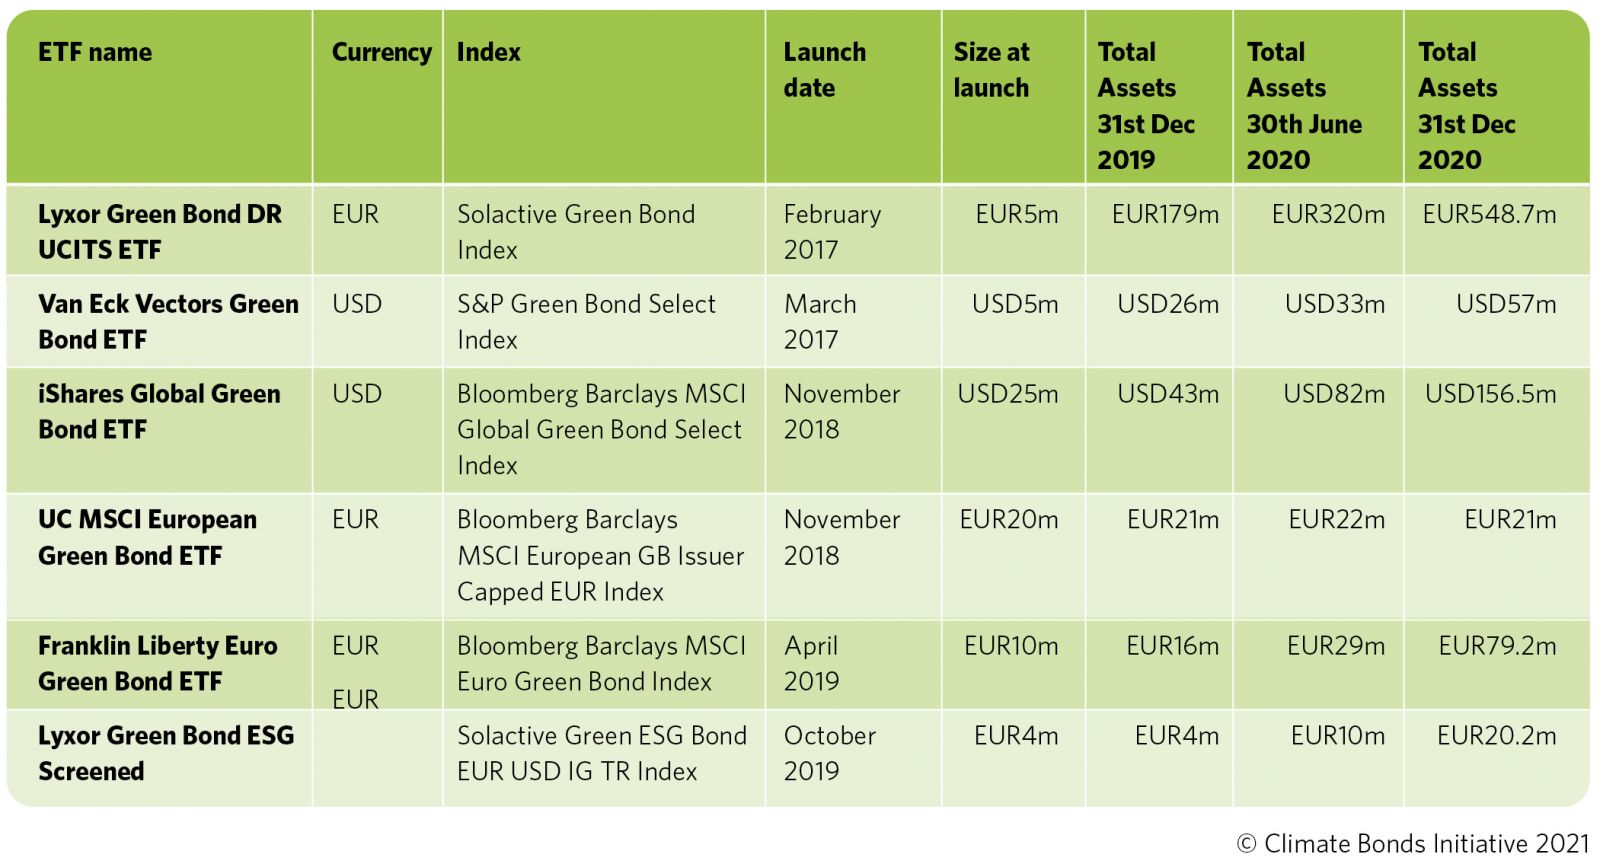

Figure 3: Currency Breakdown H2 2020