H1 highlights:
- USD74.6bn of issuance
- 670 green bond issues with 491 from the USA, 36 from Sweden and 35 from China
- 156 issuers from 31 countries
- 81 market entrants from 25 countries bring the total number of green bond issuers to 499
- 48 green bond markets reached, including three H1 additions: Indonesia, Iceland and Lebanon
- Lithuania brings the number of sovereign green bond issuers to 7
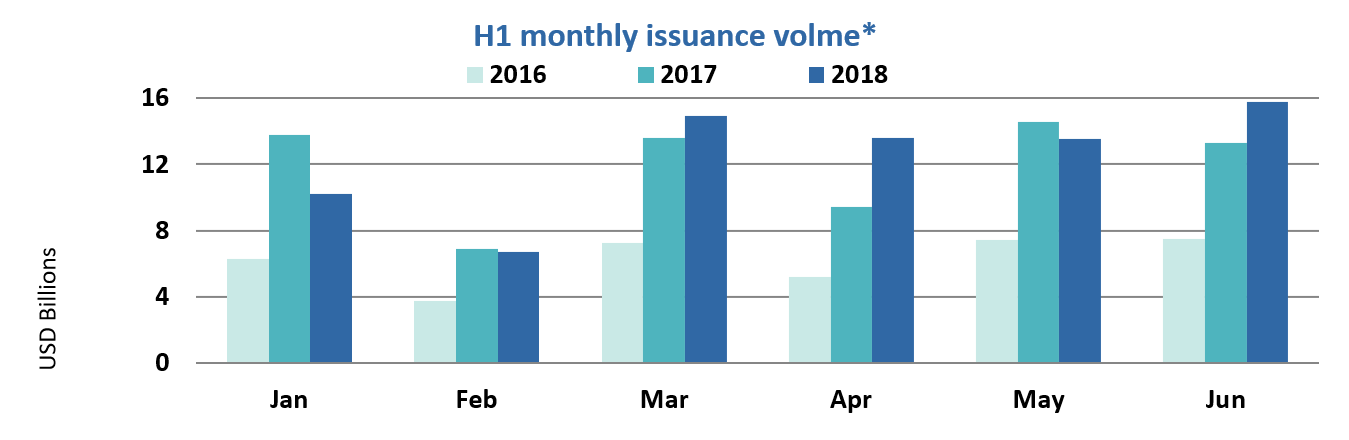
- June issuance was strong with 44 deals in 14 countries and 19 new issuers
See notes at the end of the blog for further details.
Download the full report here.
H1 at a glance
Green bonds for the first half of 2018 came from 156 issuers and totalled USD74.6bn, representing a 4% increase versus H1 2017.
Certified Climate Bonds accounted for 13% of volumes, up from 9% in H1 2017. June saw a new record for monthly certification issuance at USD6bn, with Certified deals coming from Australia, Belgium, China, New Zealand and Norway.
H1 2018 also saw a surge in covered bond issuance: new deals accounted for over 70% of cumulative covered bond figures. To date, 85% of green covered bonds finance low carbon buildings. In Q2 2018, Landshypothek Bank issued the first green covered bond secured on FSC-certified forest assets.
China drove Q2 issuance from emerging markets at 80%, followed by Indonesia and South Korea at 7% each. Overall, emerging market green bonds (including supranationals) represent 28% of H1 volumes, versus 25% in 2017.
We welcomed sovereign issuance for four months in a row, with the latest debut sovereign green bond coming from the Republic of Lithuania. July has started with yet another re-opening of France’s sovereign Green OAT for an additional EUR4bn.
Local government green bond H1 volume decreased as US Muni issuance fell
Green bonds from local governments totalled USD2.1bn in H1, or 3% of issuance, down from 9% in 2017. H1 deals came from 17 issuers from four countries, with new entrants accounting for 30% of volumes.
Since US Muni bonds account for over 70% of worldwide cumulative local government green bond issuance to date, the drop in H1 2018 volume inspired us to conduct some further analysis.
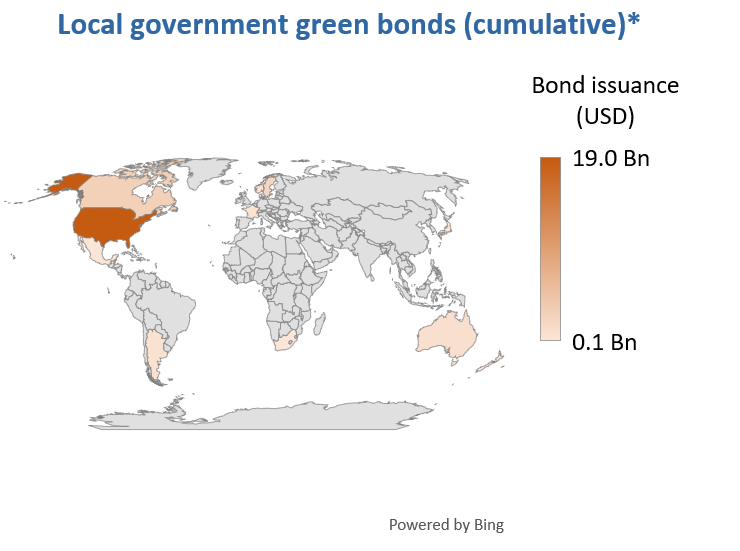
*2012 through 30 June 2018
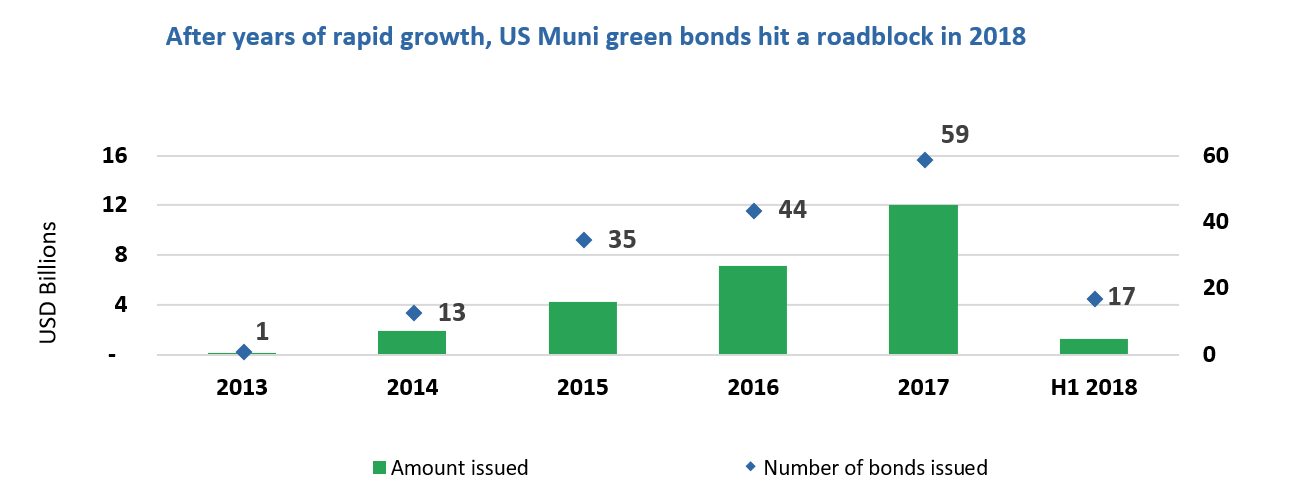
Scaling up US Muni green bond issuance
US Muni green bond issuance dropped in H1 2018. This is in line with a wider trend in US Muni issuance. The passing of the Tax Cuts and Jobs Acts of 2017 by Congress in December 2017 resulted in a major alteration to US tax law. This has impacted the issuance of refunding bonds in particular, according to SIFMA monthly data.
We conducted a scoping exercise to identify climate-aligned US municipal entities in the water, waste, transport, land use and renewable energy sectors, i.e. in key sectors from the Climate Bonds Taxonomy. 1,436 issuers with USD264bn in bonds outstanding were identified.
Water is the largest climate-aligned theme, but resilience financing, waste management and land use could all add diversity to the green bond market.
> Climate Bonds will soon publish its first US Muni briefing with a sector analysis outlining potential issuers which could help boost issuance, particularly in several climate-aligned categories - watch this space.
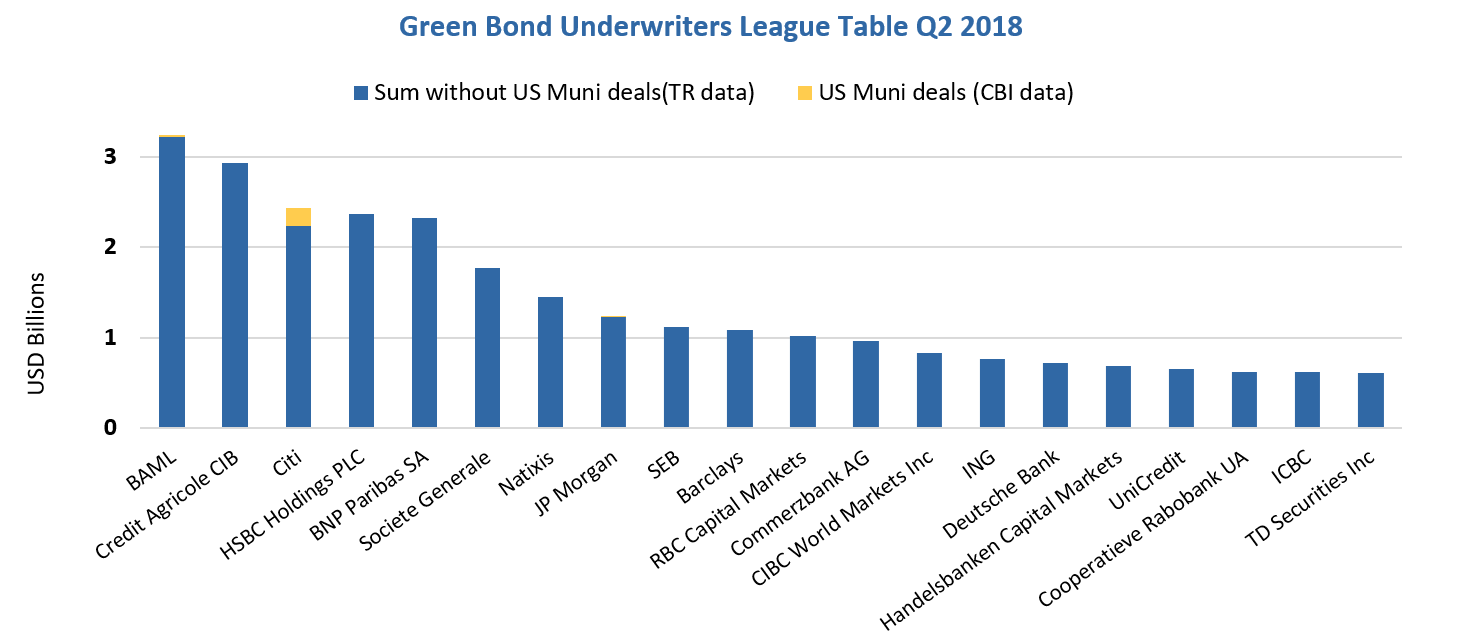
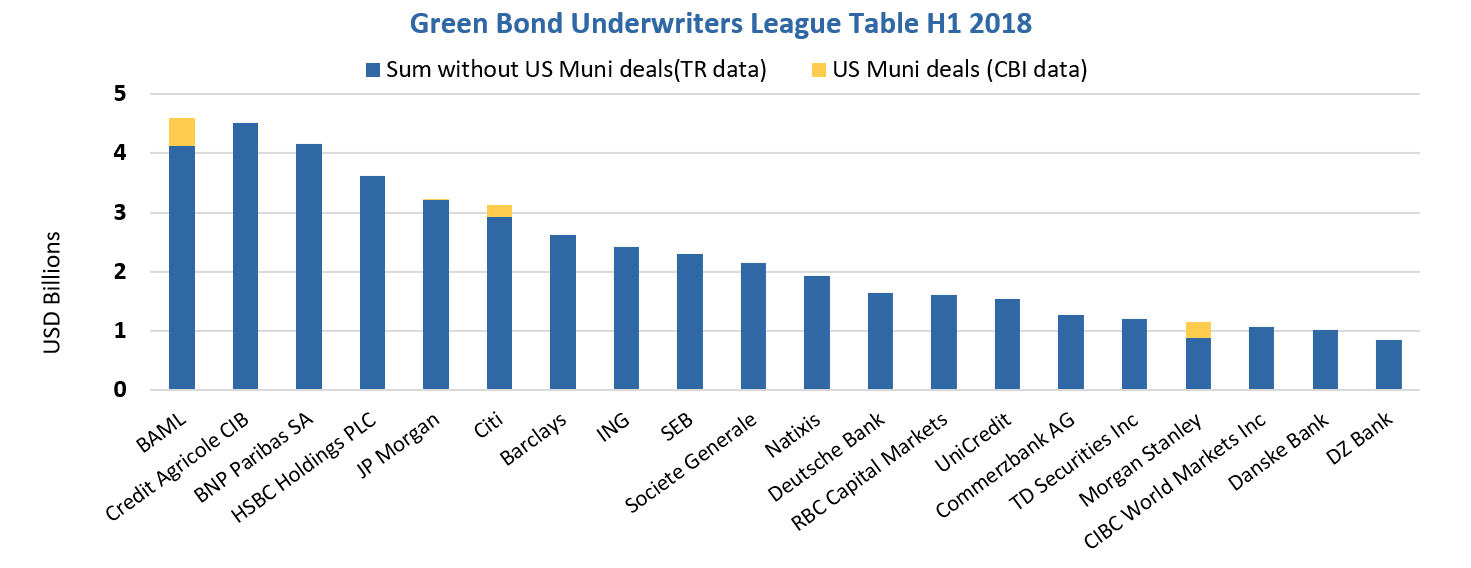
Underwriters league tables
Q2 league table shows Bank of America Merrill Lynch (BAML), Crédit Agricole CIB and Citi in the first three spots.
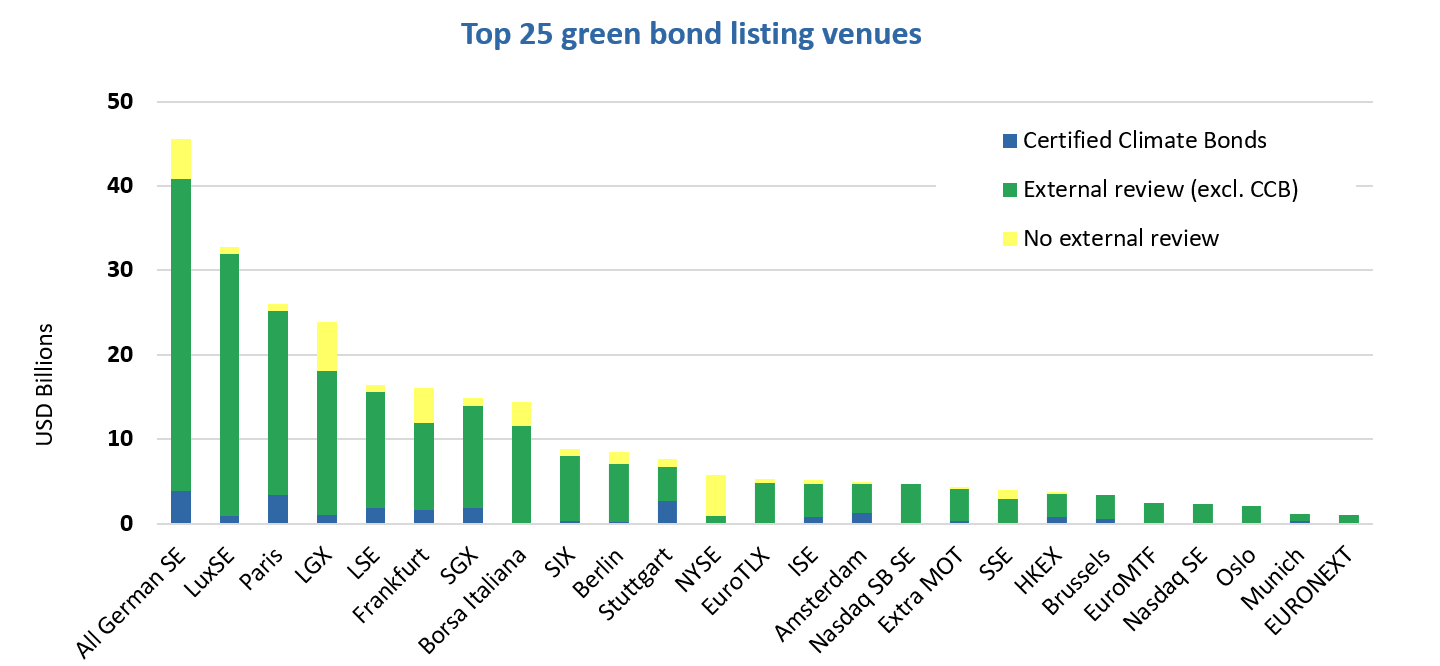
Listing venue league table
From Q2 2018, Climate Bonds Initiative will issue a listing venue league table for green bonds on a quarterly basis. As of H1 2018, USD260bn worth of green bonds have been listed on stock exchanges, accounting for 60% of the overall green bond market.
Download the full report here.
‘Till next time,
Climate Bonds
Notes: All charts and analysis are based on preliminary figures for H1 2018 issuance volume and number of deals, pending the inclusion of Fannie Mae Green MBS June deals and twelve deals still under assessment for inclusion in the CBI green bond database. Hong Kong is counted as a separate country as it is classified as a developed country according to MSCI’s Market Classification whereas China is classified as an emerging market.
