Climate change is a large-scale, long-term shift in the Earth’s weather patterns or average temperatures. Climate systems have varied naturally over the years; changes occurred in cycles over tens of thousands of years resulting in the Ice Ages and interglacial warming periods. These cycles are connected to the shape of Earth’s orbit, and the tilt and direction of the Earth’s axis. Furthermore, solar variability and volcanic activity have also impacted historic climate trends.
However, scientific research proves that natural causes do not account for recent climate change. Ten of the hottest years on record have all occurred in the last 18 years. Extreme weather events; storm surges, floods, heavy precipitation, tropical storms, heat waves, wildfires and droughts have increased fourfold over the past 35 years, from 38 events in 1980 to 174 events in 2014, leading to the cost of these disasters increasing ten-fold.
What’s the science?
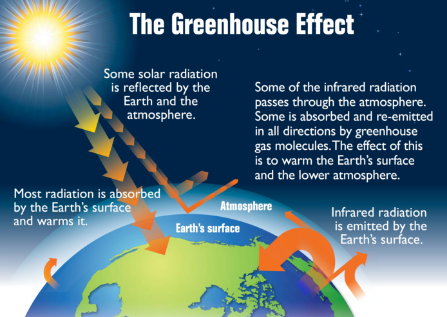 The Earth is constantly bombarded by radiation from the sun. About 30% of this is reflected back into space by clouds and ice. The rest of this heat radiation is absorbed into the land, oceans and atmosphere. As the latter heat up, they release heat back into space. Greenhouse gases in the atmosphere absorb and re-emit radiation, trapping warmth. The balance of incoming and outgoing heat radiation determines global temperatures.
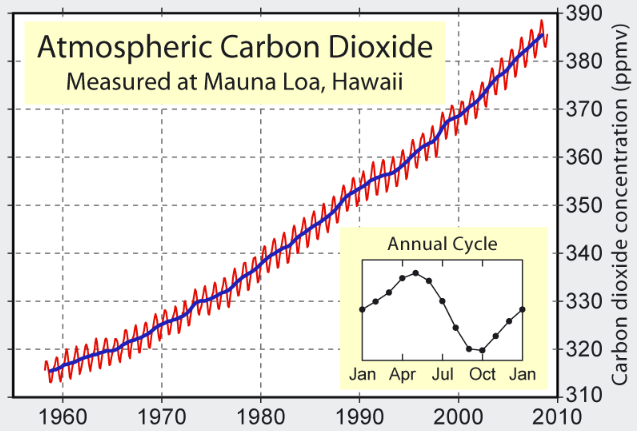
Human activity since the Industrial Revolution has been releasing more and more greenhouse gases into the atmosphere, altering the mix of gases present and therefore disturbing the solar radiation cycle. For example, before the Industrial Revolution, evidence from ice cores indicates that there was 280 parts per million of CO2 in the atmosphere. Latest measurements indicate a concentration of 406 parts per million. Notably unlike the current situation, previous climate change evidence indicates CO2 levels followed temperature changes instead of causing it.
While there is no denying that natural changes create temperature fluctuations, evidence stored in polar ice sheets indicates that:
a) The speed of the current warming phenomenon is far faster any previous temperature change
b) The current CO2 atmospheric levels are far higher than any previous ice core levels (the previous largest concentration was 330,000 years ago at a level of 300 parts per million)
c) Naturally caused CO2 fluctuations take well over 5000 years – rather than the last 150 years to change
The shift in weather patterns and average temperatures driving the discussion of climate change could only have been exacerbated to this extent by human activity producing greenhouse gas emissions.
Greenhouse Gas Emissions
What are the facts?
Greenhouse gases include Carbon Dioxide, Methane, Nitrous Oxide and halocarbons. These gases trap and absorb heat in the atmosphere. They have always existed in the atmosphere to some extent, but human activity – energy, industry, agriculture, deforestation – has been adding more.
- Carbon Dioxide (CO2 ) makes up 72% of greenhouse gas emissions. Within 200 years, up to 80% of carbon dioxide is released into oceans (which has its own impact, see below), the rest can remain in the air for hundreds of thousands of years, making CO2 build-up a long-term reality.
- Methane (CH4) accounts for 12% of GHG emissions and is shorter-lived than CO2 (lifetime in the atmosphere is approximately 12 years) but is 84 times more potent than carbon dioxide in its ability to absorb heat over a 20-year period. Over 60% of total CH4 emissions come from human activities.
- Nitrous Oxide (N2O) accounts for 9% of greenhouse gas emissions and is about 300 times more potent than carbon dioxide over a 100-year period, taking approximately 114 years to be removed from the atmosphere.
The result of this mix is that certain gases like methane contribute more to temperature rising in the short term, whereas emissions of carbon dioxide and nitrous oxide heavily influence long term climate change and global temperature rises.
Furthermore, water vapour produces many of the same effects as the above gases in trapping heat. When the atmosphere is warmer, it can hold more water. Water vapour dissipates quickly, but melting ice and general increases in temperatures over land and sea lead to greater evaporation, and more water vapour in the atmosphere, giving rise to increased precipitation.
What does this mean?
The higher concentration of greenhouse gases due to human activity has been identified as the main cause of climate change. Emissions reduction has been identified by the international community as the best way to fight the problem.
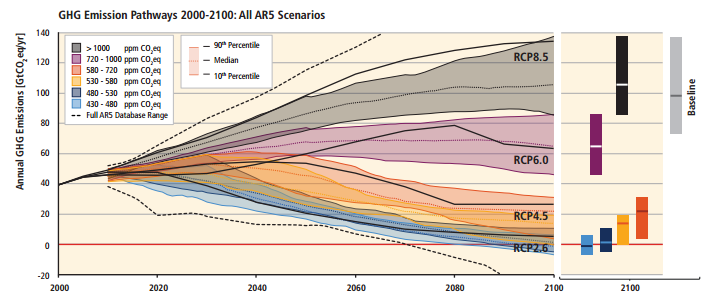
Overall targets have been defined in terms of temperature rises about the pre-Industrial average. A frequently cited aspirational goal - the 2°C target - is focused on restraining global average temperature increases to at least 2° by the year 2100 (it is far too late to work towards a zero-degree temperature rise). In contrast, if greenhouse gas emissions remain unconstrained, by 2100 the global average temperature could rise by over 4° and be set to rise further.
LONG-TERM IMPACTS OF CLIMATE CHANGE - Global temperature trajectories to 2100
|
Level of temperature change above pre-Industrial norm by 2100 |
||||
|
Type of Effect |
2°C |
4-5°C |
||
|
CO2 emissions |
Global CO2 emissions from human activity forecast to peak by 2030, before reducing by c.70% and continuing to fall. Other estimates aim for a net-zero balance of emissions whereby any CO2 production is offset by carbon sinks (eg. afforestation) |
Global CO2 emissions from human activity forecast to rise by approximately 110% by 2100 and set to continue rising beyond that time. Temperatures will rise globally, with regions near the north and south poles rising by over 6°C, leading to destructive feedback loops |
||
|
Temperature rise |
2°C. (In the scenario where countries fulfil their existing climate pledges, there is an 82% probability of temperatures increasing by 3.8°C. Therefore current country pledges of emissions reduction and climate policies are not adequate for the 2°C or less target) |
There is an 82% probability that in a business-as-usual scenario, temperatures will reach +5°C by 2100, and +6°C by 2150. The following scenario only projects to 2100, the increased temperatures thereafter would carry cataclysmic effects |
||
|
Rainfall |
5% more rainfall; 30 million people affected by flooding per year |
11% more rainfall; 1.2 billion people affected by flooding each year |
||
|
Ocean Acidity |
Ocean acidity will increase, but be capped at approximately 7.8pH, sea life moderately to severely affected depending on region, 98% of coral reefs severely affected |
Ocean acidity will increase to 7.75pH, and be set for further acidification. Shelled creatures likely to die out, plankton (the base of oceanic food chains) severely affected, fish unable to breathe, widespread species extinction and migration. Oceanic food source severely depleted |
||
|
Sea Level |
Aggregate sea level rise of 0.5m by 2100. However, beyond this date, studies indicate that an eventual rise of 3m may be ‘locked in’ and inevitable. Areas threatened are currently occupied by 130 million people* |
Sea levels set to rise by over 1m by 2100. Research also indicates that an eventual rise of up to 10m may be ‘locked in’ to occur in the further long term. Areas where up to 760 million people currently live are likely to be severely affected or underwater (high expectation that this number would increase from population rises and migration)* |
||
|
Extreme weather |
High frequency of destructive events |
Extremely high and increasing frequency of events - risks increase disproportionately with temperature rises |
||
|
Crop Yields** |
For Maize, supply is likely to remain consistent until circa 2040, and demonstrating a reasonable likelihood of increasing production thereafter up to +12% with significant irrigation and fertilisation adaptations (on a global level, including regional fluctuations). Rice yields are likely to either remain stable or, with best-case adaptation in irrigation and fertilisation, increase up to 29% by 2100. Soy yields are likely to see a small decrease in the short term, and only a marginal decrease in the long term without land use adaptation. Wheat yields have the potential to see small increases in the short term, and remaining steady in the long term. However, some forecasters suggest that every degree increase in temperature corresponds to a -6% fall in yields |
Crop yields will see widespread reductions as land become either a) unsuited to particular crops or b) unsuited for any crop growth at all. Maize yields are set to show a significant global decline in the long term, with a worst-case scenario indicating a -15% change. Rice yields, without significant adaptation, are set to decrease by 16%, but with adaptation in irrigation and fertilisation, could have dramatic increases in yield. Soy yields are, without significant adaptation in land use, likely to see significant global decreases. With adaptation, soy yields have the potential to see dramatic increases. In the long term, wheat yields are likely to decrease by 33% without significant adaptation measures. If the best available adaption takes place, yields have the potential to increase by 30% |
||
*Selection of cities affected by sea level rises, to the point to destruction in a ‘business-as-usual’ environment (the world’s Top 5 Financial Centres are all at significant risk):
Shanghai, Tianjin, Hong Kong, Guangzhou, Tokyo, Osaka, Jakarta, Bangkok, Manila, Hanoi, Ho Chi Minh City, Kolkata, Mumbai, Chennai, Karachi, Abu Dhabi, Dubai, Lagos, New York, Washington D.C., New Orleans, San Francisco, Boston, Miami, Buenos Aires, Rio de Janeiro, London, Glasgow, Venice, Barcelona, Copenhagen, Amsterdam, Lisbon
** as one region becomes worse at producing one crop, it may become more suitable for another. Projections do not include increasing land unsuitability (floods, sea level, desertification)
Extreme Scenarios
Fossil fuels are measured in the years of reserves we have left. The unspoken assumption being that they will all be used. The following indicates an extreme scenario, but one which is well within the range of possibility:
Temperatures would soar to up to 10°C (20°C in polar regions) above pre-Industrial average, all mountain glaciers, the Greenland ice cap and arctic ice would melt, as would most of Antarctica. Antarctica alone holds enough water to raise global sea levels by 58m. This would completely redraw the map.
Huge areas in equatorial regions and the gulf would become completely uninhabitable through the heat increasing beyond the human range to endure and over any ability for plant life to grow. Rainfall would dry up across Africa, the Mediterranean and South America - destroying the Amazon through decreased rain and rising temperatures. While in other regions rainfall would increase by a factor of 4, leading to unprecedented floods. In general there would be widespread plant and animal extinction, immeasurable damage to food supplies, human health and the economy.
Tackling climate change
The Paris Agreement in 2015 set out a structured agenda for combating climate change and set the 1.5 to 2°C target to radically limit climate change by 2100. To reach that target, policies of mitigation and adaptation are called for. Think of the two as the offence and defence on a team; you need to be good at both.
We have already seen from climate change, from the extreme: storm surges in New York, flash urban floods in Rio de Janeiro from unprecedented rainfall; to the more subtle and long term effects: new beetle infestations of coffee crops from Africa to Latin America, the threat of sea level rise to urban areas worldwide. These are examples of climate change effects that Adaptation can address; by developing safeguards and resilient infrastructure and policies to protect against widespread, costly damage.
Mitigation policies call for the aggressive reduction in anthropogenic greenhouse gas emissions; in energy efficacy in buildings and cities, to power production, transport, changes in land use and agriculture practices, industry and manufacturing and waste disposal.
Climate change risk
Portfolios are exposed to climate change in the following risks: physical, transitional, change in risk premiums, technology and policy.
Incorporation of climate change impacts is gaining momentum as an additional tool in understanding the value at risk of portfolios. Research indicates that between USD2.5 trillion and USD4.2 trillion of global financial assets are at risk of climate change, and has the potential to be over USD24 trillion if nothing is done to mitigate and adapt to climate change. Indirect portfolio damage through weaker growth and lower asset returns is another issue alongside the direct damage. For example, oil and gas companies are facing significant stranded assets as fossil fuel reserves already far exceed the level of projected emissions agreed on internationally. Other stranded assets could include businesses in areas that become prone to flooding or at risk of sea level changes. Aligning portfolios with assets connected with a 2°C or less target significantly mitigates the financial risk.
Frequently seen terms:
- Adaptation and mitigation: This refers to a two-pronged strategy to combat climate change. Mitigation refers to efforts to reduce and stabilise the emission of greenhouse gases. Adaptation refers to efforts to adapt to the climate change we cannot prevent. Mitigation will require adjustment of energy sources, industrial usage, transport and efficiency across the board; adaptation will carry significant costs in building the necessary resilience to the impacts of climate change, however, the greater the mitigation efforts, the less costly adaptation will need to be.
- 2°C trajectory: this is an envisaged upper-limit goal of global mean temperature increase above the pre-Industrial level specified in the Paris Agreement. An internationally recognised threshold for dangerous levels of warming. Even this target will require extensive mitigation and adaptation measures to achieve, including net-zero emissions levels by 2100.
- Kyoto protocol: Adopted in 1997 and entered into force in 2005, this international agreement sets emission reduction targets. While the US signed the Protocol, they did not ratify it. Also in 2012 Canada withdrew from the agreement.
- Paris agreement: Signed by 178 countries, the Agreement aims to limit global temperature increases to ‘well below’ 2°C above the pre-industrial average, increase climate-resilient adaptation and make finance flow consistent with that pathway. The idea is to reach ‘peak emissions’ as quickly as possible, particularly for developing countries, and then quickly reduce emissions and develop carbon sinks particularly in the second half of the century. The Paris Agreement also requires the mobilisation of climate finance sources, instruments and channels.
Recommended further reading:
- New York Times, Justin Gillis (2017): Climate Change Is Complex. We've Got Answers to Your Questions.
- IPCC (2014): 5th Assessment Synthesis Report - Summary for Policymakers
- MIT Joint Program on the Science and Policy of Global Change (2016): Scenarios of Global Change: Integrated Assessments of Climate Impacts
- Shell Scenarios (2016): New Lens Scenarios: Pathways to Net-Zero Emissions
- LSE, Nicholas Stern (2006): Review on the Economics of Climate Change
- The Economist Intelligence Unit (2015): The Cost of Inaction