Q3 sees the biggest single issuance this year so far of $1.1bn (thanks to NWB Bank) and overall total issuance is $6.9bn for the quarter. The green bond market has slightly slowed from a high in Q2. But, it seems like the issuance is going up in size – the average in Q3 bonds ($204m) is well above the Q2 figure of ($144m).
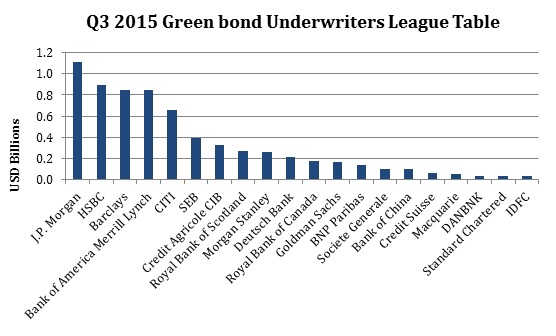
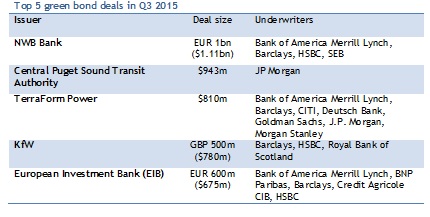
Top of the Q3 table is JP Morgan, underwriting a mix of corporate, development bank and municipal green bonds just over $1.1bn. The biggest municipal green bond, second largest deal of this quarter, by Central Puget Sound Transit took its sole underwriter JP Morgan (JPM) straight to the top and accounted for 85% of JPM’s Q3 total. Other boost also came from its sole underwriting for IFC green masala bond and joint bookrunning with BAML, Barclays, CITI, DB, GS, and MS for the $800m TerraForm Power green bond.
A big leap forward by HSBC to rank second in Q3, first time to join the quarterly top five underwriter this year! All of the green bond deals it took part in are joint underwriting with other entities, adding up to $894m. Three of its deals – NWB Bank, KfW and EIB – are among the five largest deals of the quarter, pushing HSBC much forward this quarter. HSBC were also the bookrunner for the first corporate green bond in India issued by CLP Wind Farms India.
BAML, who is the leader in the YTD league table (see below), remained in the top 3 but slightly slipped to the third this quarter. It remains active in the market, underwriting a total of eight deals worth of $845m, in which three are among the five biggest deals of Q3. It is the bookrunner for all of its green bond deals – two bonds for TerraForm Power, EIB, two bonds for SolarCity, NWB Bank, and Nordic Investment Bank, and the sole underwriter for the green guarantees by OPIC.
Closely following BAML is Barclays made a big jump from 13th place in Q2 to the 4th in Q3. All of its six green bond deals are jointly underwritten with other entities, in which four of them are listed in the five largest deals of the quarter. Although the number of deals it underwrote is less than the top 3 underwriters, the total amount issued is not much less at $849m.
Ranked the 5th largest underwriter in Q3, CITI underwrote $655m of the six green bond deals this quarter. Remaining its place in top 5 in 2015 YTD, it is the sole underwriter for three municipal green bonds issued by the New York State Environmental Facilities and as a joint underwriter for the two green bonds by TerraForm Power and TerraForm Global, and the €300m CAB by EIB.
New in the top 20 is Bank of China, signalling the recent proactive initiatives in mobilising green bond market in China. With the exciting momentum for green bonds in China and Asia, we are expecting some new underwriters from Asia in Q4 scoring in the league table!
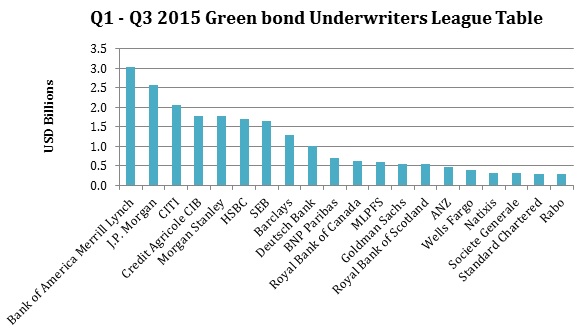
Zoom out to the year-to-date league table, the places shuffled around a little bit while the underwriters often sit at top 5 remains – Bank of America Merrill Lynch, JP Morgan, CITI, Credit Agricole CIB and Morgan Stanley.
Understanding our league table
There are quite a few green bond league tables around these days; Environmental Finance launched its green league table last week with very similar results to our Q3 findings. Bloomberg New Energy Finance’s (BNEF) league table has the same underwriters in the top 5 for Q3, but the ranking is slight different because BNEF also includes unlabelled project bonds, US municipal Clean Renewable Energy Bonds (CREBs) and Qualified Energy Conservation Bonds (QECBs) in their numbers.
There are plenty of ways to make a league table and each bring with them different outcomes, so here are a few notes about our league table:
- Graphs include only the largest 20 underwriters in each time period but there are many others that have underwritten deals
- All data includes only bonds labelled and marketed to investors as ‘green’ or ‘climate’, the primary definition of this market. This means that figures do not include renewable energy projects or other bonds linked to green projects but not labelled and marketed as such
- Totals are calculated by taking the total deal size divided by the number of lead managers as is the general practice (with exception of the US municipal bonds where the total deal size is allocated to the lead underwriter which follows the general practice in the US municipal bond market)
- Other league tables representing a larger market would usually present data by year, by currency or both. Given that this green bonds market is still relatively small, there is limited scope to break up the market at this stage
- Some issuances fall on the cusp of the quarter in which case we use the announcement date as recorded on Bloomberg to determine its quarter
- Exchange rates taken as the last price on the announcement date
