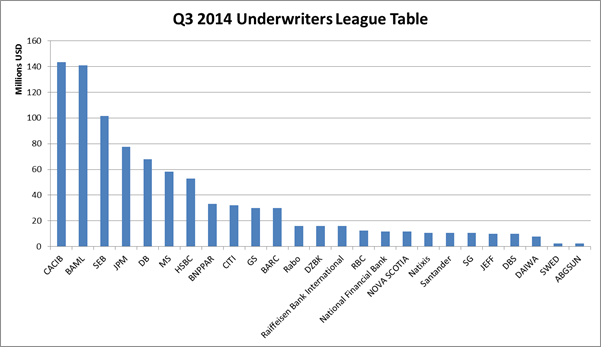
Credit Agricole CIB (CACIB) and Bank of America Merrill Lynch (BAML) overtook SEB in Q3 to take the top two spots in the underwriters League Table.
CACIB leads BAML by a narrow margin with both banks involved in over $140m of deals during the quarter. CACIB was a lead underwriter on four of the top five deals of the quarter, including the huge KfW EUR 1.5bn bond. BAML was also an underwriter for the majority of the five deals, such as NRG Yield and NIB.
JP Morgan, Deutsche Bank and Morgan Stanley have come back in to the top 10 this quarter. Whilst the biggest players in Q2 such as HSBC and Natixis have dropped down a few places..
Most of the other banks in the top 10 are regulars in the Tables, having appeared on our Q2 and Q1 league tables. Newcomers to the league table in the quarter are; Raiffeisen Bank International, National Financial Bank, Bank of Nova Scotia, Jefferies International Ltd, DBS Bank, Swedbank and ABG Sundal Collier.
The total amount issued in Q3 was $9.15bn. After a strong start in July $3.18bn issued there was a lull in August when only $0.65bn issued (evidence that even bankers take a Northern Summer holiday) made up for by a busy September that accounted for over half ($5.3bn) the quarter's total.
The five largest deals were:
| Issuer | Size | Lead Underwriters |
|---|---|---|
| KfW | EUR 1.5bn ($2.04bn) | CACIB, DB and SEB |
| AFD | EUR 1bn ($1.3bn) | BAML, BNPPAR, CACIB and HSBC |
| EIB | EUR 500m ($645m) | CACIB, DZK, RABO and Raiffeisen Bank International |
| NRG Yield | $500m | BAML, CITI, GS, RBC |
| NIB | $500m | BAML, CACIB, SEB |
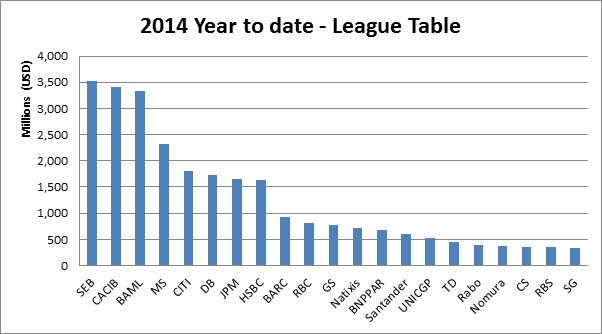
We've been wondering how SEB's Christopher Flensborg will react to losing the top spot in the quarterly League Table for the first time. Will he weep and gnash his teeth, or will he just be proud that all the work he's done to help grow this market has led to it taking off?
But consolation exists: the year to date League Table still has SEB out ahead due to deals made in quarters one and two. With a busy November expected we will wait to see if any of the other banks can challenge this lead.
Notes and caveats:
There are plenty of ways to make a league table and each bring with them different outcomes so here are a few notes...
- Graphs include only the largest underwriters in each time period but there are many others that have underwritten deals.
- All data includes only bonds labelled and marketed to investors as ‘green’ or ‘climate’, the primary definition of this market. This means that figures do not include renewable energy projects or other bonds linked to green projects but not labelled and marketed as such.
- Totals are calculated by taking the total deal size divided by the number of lead managers as is the general practice
- Other league tables representing a larger market would usually present data by year, by currency or both. Given that this green bonds market is still relatively small, there is limited scope to break up the market at this stage.
- Some issuances fall on the cusp of the quarter in which case we use the announcement date as recorded on Bloomberg to determine its quarter.
