Media release
London 23 January 2014 - The Climate Bonds Initiative today released its Green Climate Bonds Underwriters League Table for 2013.
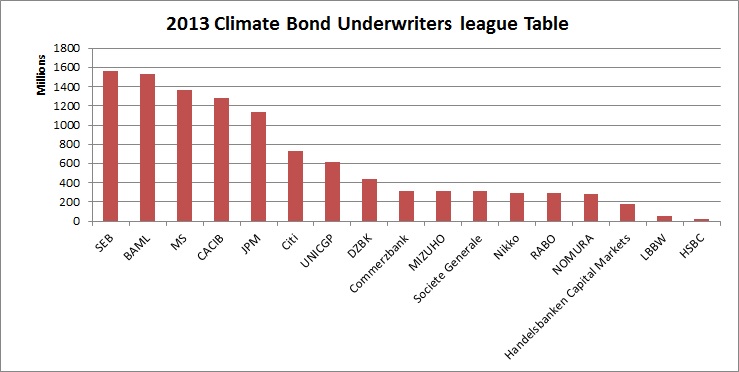
Some $10 billion of Green Climate Bonds were issued in 2013, the biggest year yet, and one which saw new issuers, investors and underwriters join the market.
Climate Bonds CEO Sean Kidney said: “The Green Bond Underwriters League Table shows that five banks were the main drivers of growth in the ‘labelled’ market in 2013: SEB, BoAML, Morgan Stanley, Credit Agricole and JP Morgan. These banks were involved in most of the headline deals in 2013, including EDF (EUR1.4bn), IFC’s two $1bn bonds and EIB’s 2013 Climate Awareness bonds. “
Kidney added: “Underwriters are now fully behind growing this market, not just from a technical perspective in structuring deals but also by pushing the concept of green bonds issuance to clients who may not otherwise have considered issuing. The recently released Green Bonds Principles, signed by 13 global banks, demonstrates their commitment to growing the market.”
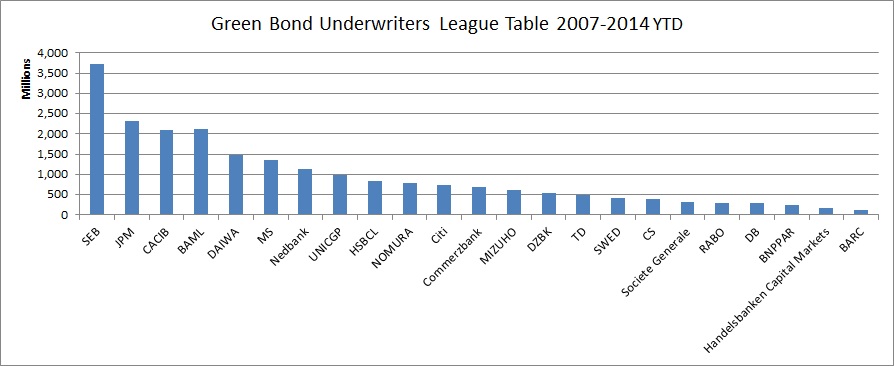
The chart below demonstrates which underwriters have been involved in the market from its inception in 2007 and includes matured bonds and smaller retail bonds. This shows SEB in the lead followed by JP Morgan, Credit Agricole and Bank of America Merrill Lynch (BoAML). This is an unusual way of representing a league table (usually each year is represented separately) but provides a useful snapshot of who has been involved from the beginning.
Notes and caveats
There are plenty of ways to make a league table (as we’ve discovered) and each bring with them different outcomes so here are a few notes and caveats...
All data includes only bonds labelled and marketed to investors as ‘green’ or ‘climate’, the primary definition of this market. This means that figures do not include renewable energy projects or other bonds linked to green projects but not labelled and marketed as such and that do not apply reporting mechanisms as outlined in the Green Bond Principles.
A league table for bonds related to climate change ($346 billion at last count) will be included in the 2014 Bonds and Climate Change: State of the Market report due out later this year.
This league table splits up each deal size by the number of lead managers as is the general practice, but we note that this can have a distorting impact – e.g. Nedbank appears high on the list due to its involvement as sole arranger for R5.2bn ($650mn) Industrial Development Corp green bond in South Africa.
Other league tables representing a larger market would usually present data by year, by currency or both. They would also not usually include mature bonds (as we have done in the second chart) or retail bonds (as we have done in both charts). Given that this green bonds market is still relatively small, there is limited scope to break up the market at this stage. However, for consistency, we’ve provided some further league tables here breaking the market down by currency, year and retail distribution.
