By Bridget Boulle
In the April-June quarter this year SEB, a Swedish bank, again took the top spot in our Green Bond Underwriters League Table, followed by HSBC, a large global bank, who had a very good quarter, and Credit Agricole CIB.
Most of the other banks in the top 10 are regulars in the Tables, having appeared on our last league tables here and here.
The big jumper was Natixis, a french investment bank, which has not appeared on any of our previous league tables and is up in fourth place for the quarter due to being on large deals such as GDF Suez.
SEB maintains its lead, because, while not being on any of the three largest deals (see below), it was the sole underwriter for many of the SEK-denominated deals including Skanska, Stockholm Lans Lansting, City of Gothenburg and others.
The total amount issued in Q2 was just over 10bn – around a billion more than Q1.
Q2 underwriters league table (USD)
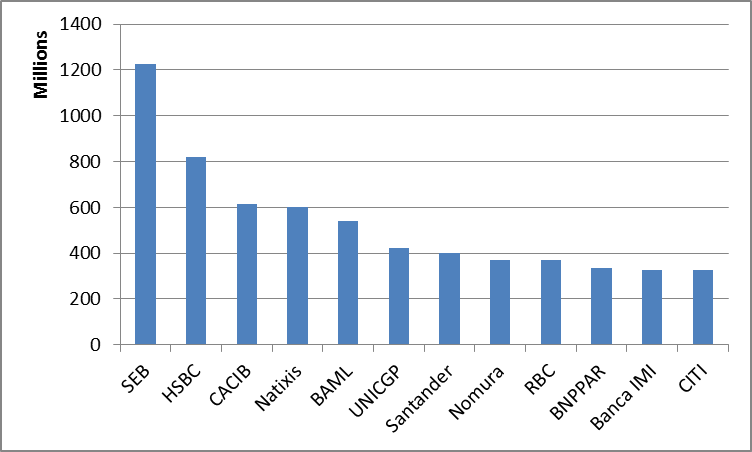
Acronym guide: SEB is Skandinaviska Enskilda Banken, CACIB is Credit Agricole CIB, RBC is Royal Bank of Canada, BAML is Bank of America Merrill Lynch, UNICGP is Unicredit.
The three largest deals were:
|
Issuer |
Size |
Lead Underwriters |
|
GDF Suez |
EUR2.5bn ($3.44bn) issued in two tranches |
Joint leads including: Citi, Credit Agricole CIB, RBC, BAML, BNP Paribas, Unicredit, Santander, Natixis, Banca IMI |
|
Iberdrola |
EUR750bn ($1.03bn) |
|
|
Il-de France |
EUR600m ($829m) |
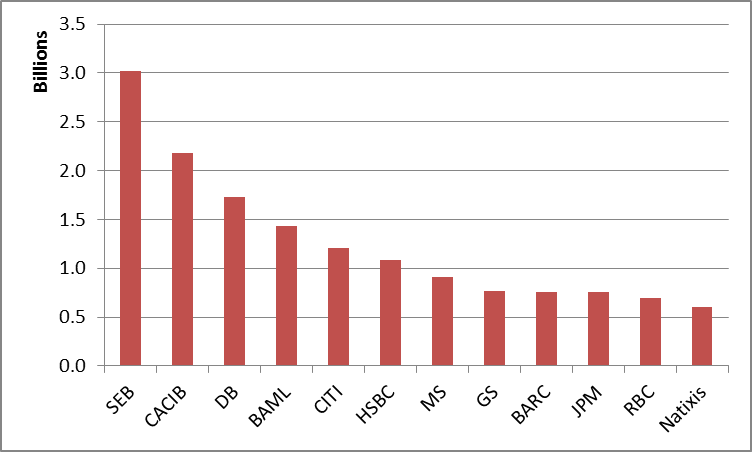
Year to date
Looking at the year to date (up to the end of last week with the NRG bond) shows SEB still upfront but followed by Credit Agricole CIB, Deutsche Bank and Bank of America Merrill Lynch.
Notes and caveats:
There are plenty of ways to make a league table and each bring with them different outcomes so here are a few notes...
- Graphs include only the largest 12 underwriters in each time period but there are many others that have underwritten deals.
- All data includes only bonds labelled and marketed to investors as ‘green’ or ‘climate’, the primary definition of this market. This means that figures do not include renewable energy projects or other bonds linked to green projects but not labelled and marketed as such.
- Totals are calculated by taking the total deal size divided by the number of lead managers as is the general practice
- Other league tables representing a larger market would usually present data by year, by currency or both. Given that this green bonds market is still relatively small, there is limited scope to break up the market at this stage.
- Some issuances fall on the cusp of the quarter in which case we use the announcement date as recorded on Bloomberg to determine its quarter.
- Exchange rates taken as the last price on the announcement date
