Our Quarterly comparison between the behaviour of selected green and vanilla bonds in the primary market continues.
Data sample expands further with the second report of the Green Bond Pricing in the Primary Market series.
What’s it all about?
We have just released our second “Green Bond Pricing in the Primary Market” report analysing the performance of green bonds at issue April-June 2017, in partnership with the IFC and support from partners.
The report is a continuation of our ongoing assessment of green bonds pricing. A preliminary ‘Snapshot’ briefing paper examining Q4 of 2016 was produced for the 2017 Climate Bonds Annual Conference in March, and the first Green Bond Pricing Report examining eligible green bonds from 2016 & Q1 of 2017 was released in August.
The analysis is based on a total sample of 131 bonds, 19 of which are green bonds and 112 are vanilla bonds.
More details on the methodology can be found in pages 14-15 of the report.
Download the full report here.
Highlights from Q2
- Ten EUR and nine USD labelled green bonds issued in Q2 2017 were analysed
- The pool of green bond issuers continues to grow, extending investor choice
- Issuers of green bonds reiterate that they can access a broader investor base compared to vanilla bonds
- 54% of green bonds were allocated to dedicated green investors. Green and ESG based mandates are supporting market growth
- Oversubscription and tight pricing are a feature of the market
- EUR Corporate credit performed particularly well in the immediate secondary market
Detailed Findings:
- USD denominated green bonds price on average 15.4bps tighter than IPT. This is tighter than vanilla bonds issued during the same period. EUR denominated green bonds price on average -6.3bps tighter than IPT, average for vanilla equivalents is -9.4bps
- EUR green bonds achieve slightly bigger order books (2.3 times covered) than a comparable vanilla sample (2.2 times covered). USD green bonds achieve the same sized order books (2.8 times cover) as vanilla equivalents
- All 5 EUR corporate green bonds perform well on all metrics – spreads tighten more than baskets of comparable vanilla bonds after both 7 and 28 days, and spreads tighten more than indices after both 7 and 28 days
- 54% of green bonds were sold to green investors, this figure was 62% for bonds originating from Developed Markets, and 25% for bonds originating from Emerging Markets
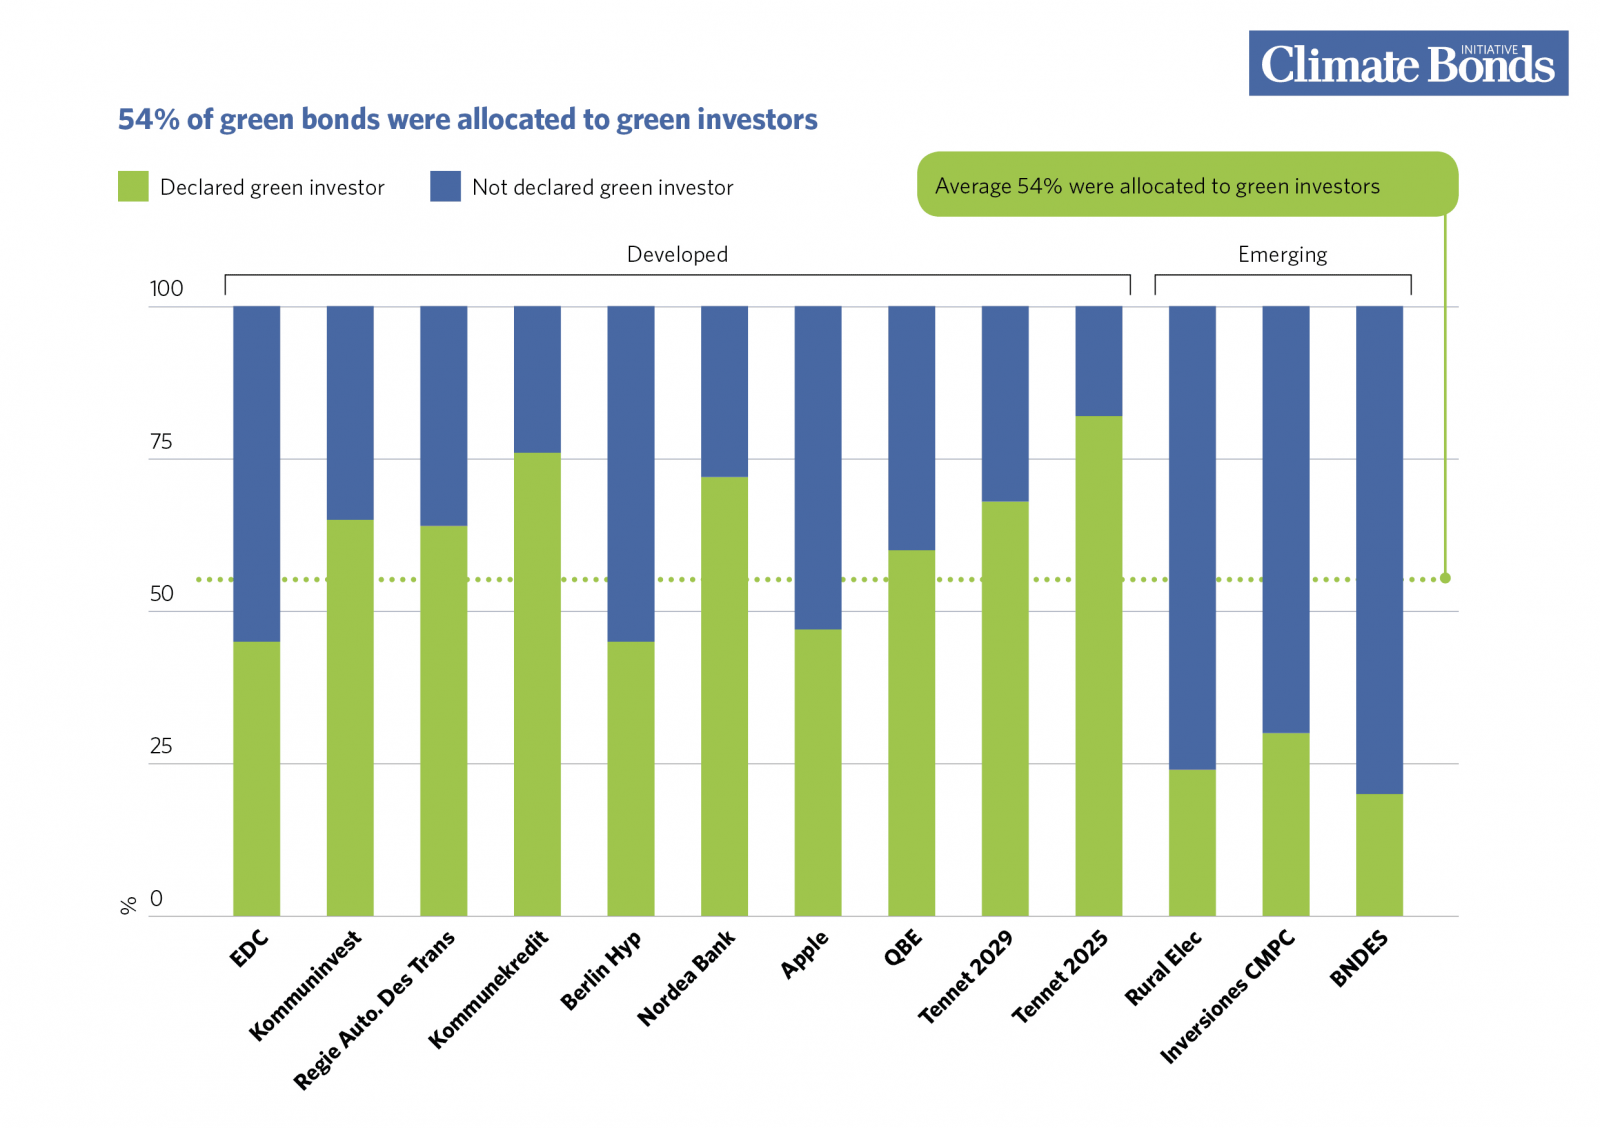
Figure 1: 54% of green bonds were allocated to green investors
Methodology
This paper includes labelled green bonds issued during the second quarter of 2017. We have included all green bonds meeting the following specifications:
- Announcement date between 30th March and 30th June 2017 (except for First Abu Dhabi Bank, issued 27th March 2017, but not picked up in our prior publication)
- Denominated in either USD or EUR
- Size >= USD300m
- Investment grade rated
- Minimum term to maturity of three years
- Consistent with Climate Bonds Taxonomy
- Amortising bonds are excluded
Who’s saying what?
Peer Stein, Global Head of Climate Finance, Financial Institutions Group – IFC
“Pricing advantages and investor diversification remain among the most talked about topics for green bonds.
With this second publication in a joint series with the Climate Bonds Initiative, IFC is committed to contributing facts and greater transparency to this discussion.”
Julie Fox Gorte Ph.D, Senior Vice President for Sustainable Investing, Pax World
“Pax welcomes this evaluation of the performance of green bonds by the Climate Bonds Initiative.
It is nice to see that green bonds are in demand, as well as information on credit spreads and performance. All of it speaks to the market for green bonds continuing to be strong, and we’re going to need that strength.”
Sean Kidney, CEO, Climate Bonds Initiative
“Clear distinctions between green and vanilla bonds performance are still hard to pinpoint at this stage of market development, despite the anecdotal evidence emerging.
The green bond space is evolving fast and we expect that the dynamics may change as the market matures. Climate Bonds will continue its rigorous analysis of the market and the expansion of our data sample in future quarters.”
The Last Word
As we have already underlined for the previous two reports, the subject is quite complex. The limitations on sample data and the ongoing development of the market makes it hard to derive more comprehensive conclusions at this stage.
However, some trends are already being picked-up by our analysis.
Despite the limited presence of large corporate bonds to date, the expansion of the green bond market offers investors a broader choice of instruments.
Green bonds also provide issuers with the opportunity to broaden their investor base while consolidating their commitment to investing in climate change solutions.
All in all, we can’t declare the existence of a “Greenium” just yet, but there are signs of both issuers and buyers benefiting from green bonds relative to vanilla bonds.
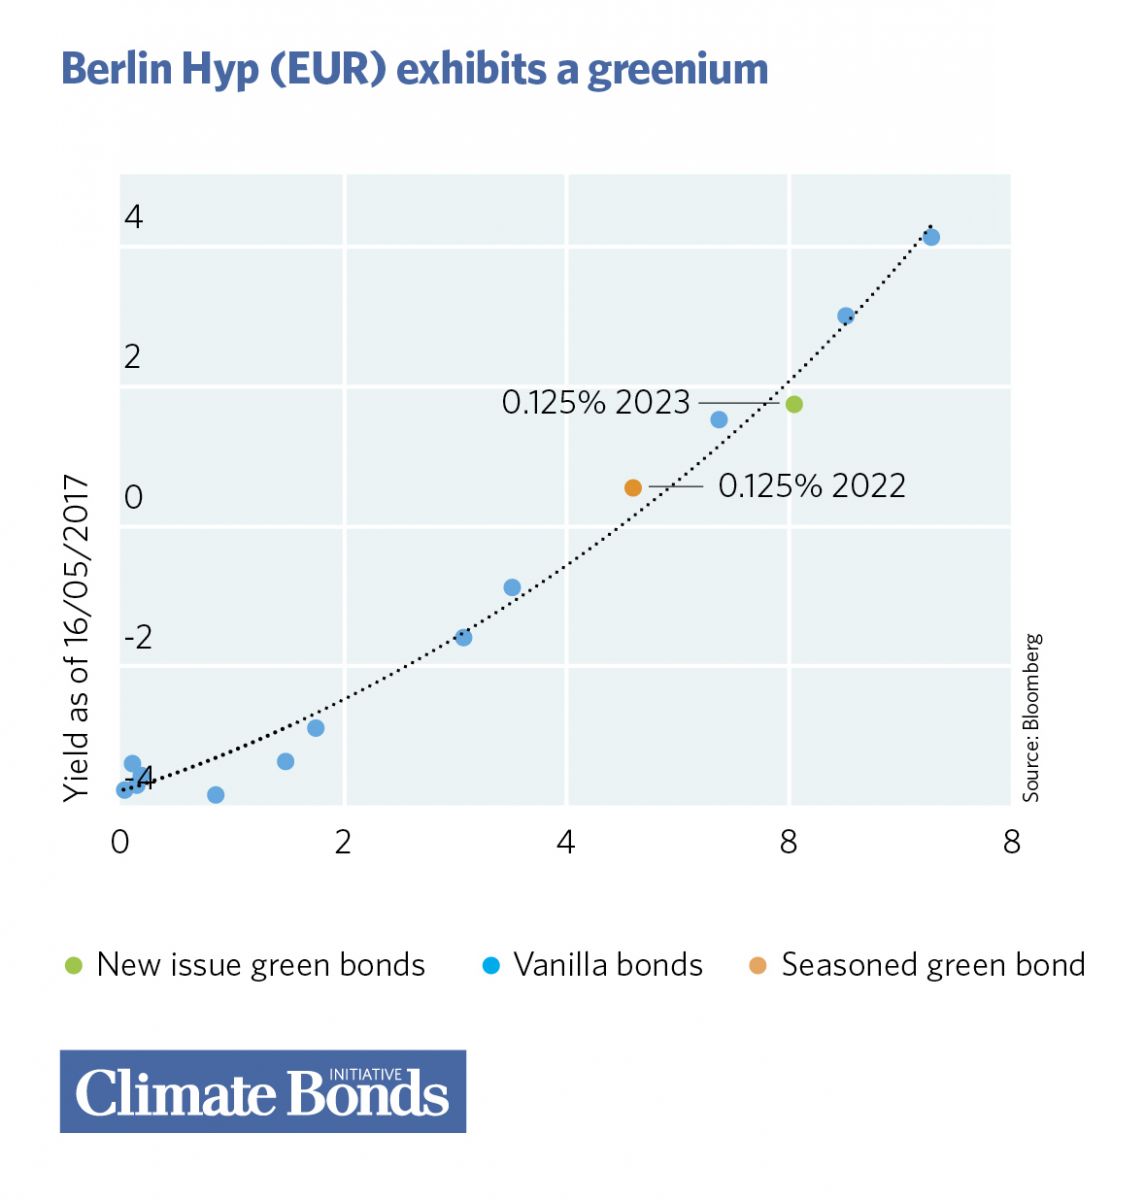
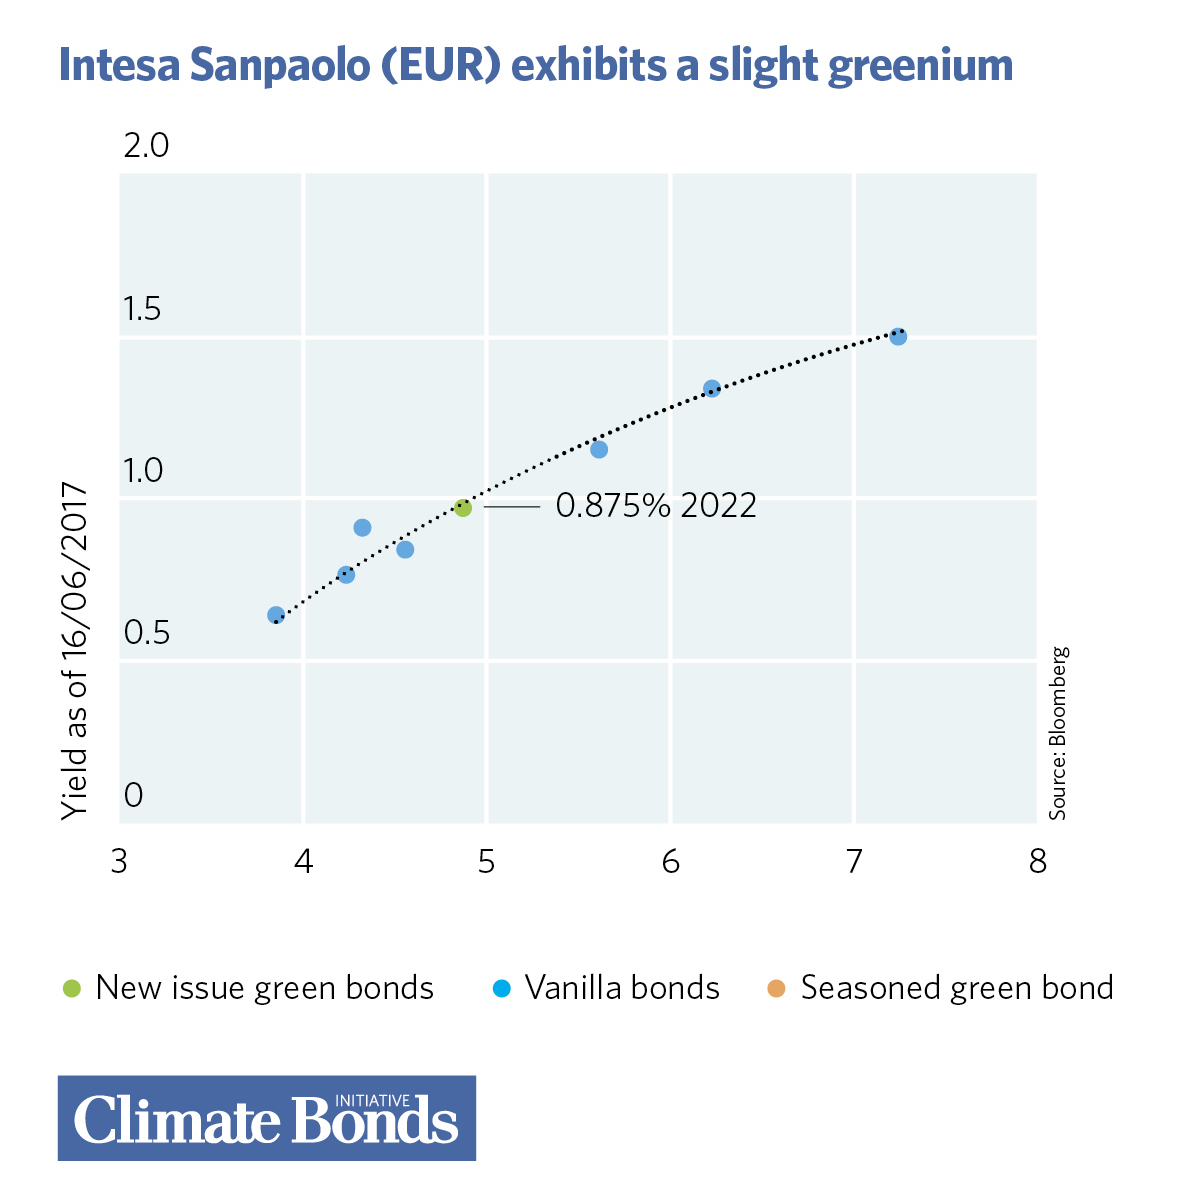
Figure 2: pricing examples
This publication is part of an ongoing series. The next edition will monitor qualifying bonds issued in Q3 July to September 2017. As well as the metrics we have included here, we may examine other ways of comparing green bonds to a vanilla sample.
Stay tuned!
‘Till next time,
Climate Bonds
P.S. We will soon be opening registrations for our “Greenium” webinar introducing the report and discussing green bond pricing in the primary market, taking place on the 27th of November.
Disclosure: The paper was prepared jointly by the Climate Bonds Initiative and the International Finance Corporation (IFC) with support and funding from Pax World Mutual Funds, Obvion Hypotheken, and Rabobank. Additional funding was received from the Ministry of Finance of Japan and the Government of the Kingdom of Denmark through the Ministry of Foreign Affairs.
Disclosure: Several organisations named in this communication are Climate Bonds Partners. A full list of Partners can be found here.
Disclaimer: The information contained in this communication does not constitute investment advice in any form and the Climate Bonds Initiative is not an investment adviser. Any reference to a financial organisation or debt instrument or investment product is for information purposes only. Links to external websites are for information purposes only. The Climate Bonds Initiative accepts no responsibility for content on external websites.
The Climate Bonds Initiative is not endorsing, recommending or advising on the financial merits or otherwise of any debt instrument or investment product and no information within this communication should be taken as such, nor should any information in this communication be relied upon in making any investment decision.
Certification under the Climate Bond Standard only reflects the climate attributes of the use of proceeds of a designated debt instrument. It does not reflect the credit worthiness of the designated debt instrument, nor its compliance with national or international laws.
A decision to invest in anything is solely yours. The Climate Bonds Initiative accepts no liability of any kind, for any investment an individual or organisation makes, nor for any investment made by third parties on behalf of an individual or organisation, based in whole or in part on any information contained within this, or any other Climate Bonds Initiative public communication.
